Revolution#
+ Expand
- What makes for a suitable problem for AI (Demis Hassabis, Nobel Lecture)?
- Space: Massive combinatorial search space
- Function: Clear objective function (metric) to optimize against
- Time: Either lots of data and/or an accurate and efficient simulator
- Guess what else fits the bill (Yours truly, amateur philosopher)?
- Space
- Intestines/villi
- Lungs/bronchioles
- Capillary trees
- Network of lymphatics
- Dendrites in neurons
- Tree branches
- Function
- Energy
- Aerobic respiration
- Delivery to "last mile" (minimize distance)
- Response time (minimize)
- Information
- Exposure to sunlight for photosynthesis
- Time
- Nourishment
- Gaseous exchange
- Oxygen & Nutrients (Carbon dioxide & "Waste")
- Surveillance for antigens
- Coherence of functions
- Water and nutrients from soil
The five sequences—Nihilism through Integration, Lens, Fragmented to United, Hate to Trust, and Cacophony to Symphony—provide a framework to explore stakeholder interactions within the clinical research ecosystem, exemplified by a web app for living donor nephrectomy decisions. This ecosystem teems with actors: students, professors, care providers, patients, analysts, academic departments, administrators, and federal employees with access to data like NHANES. Each sequence reflects how these stakeholders interact—colliding, collaborating, and coalescing—around the app, which generates Kaplan-Meier curves to weigh outcomes like perioperative mortality or long-term ESRD risk. These interactions, mediated by tools and tensions, reveal the ecosystem’s pulse and its capacity to navigate complex decisions.
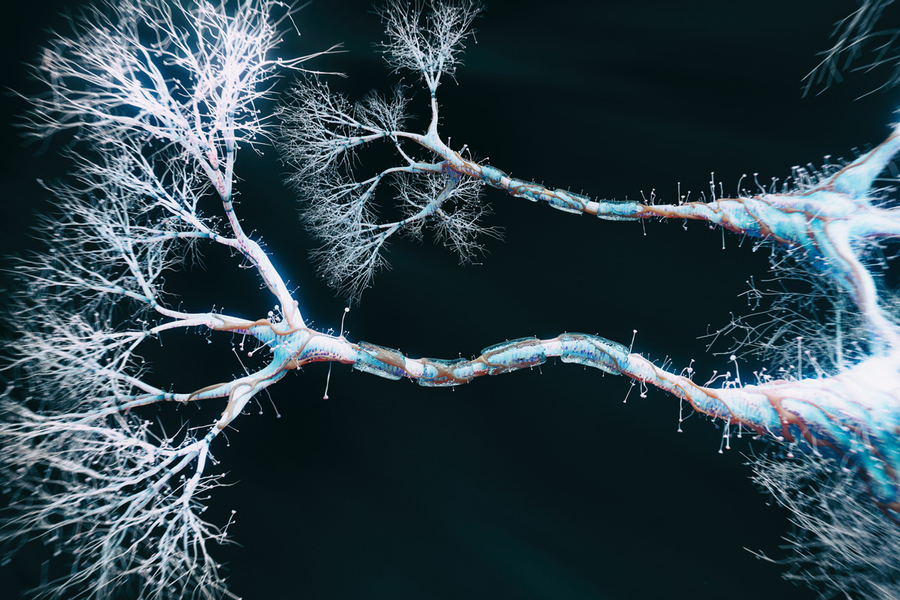

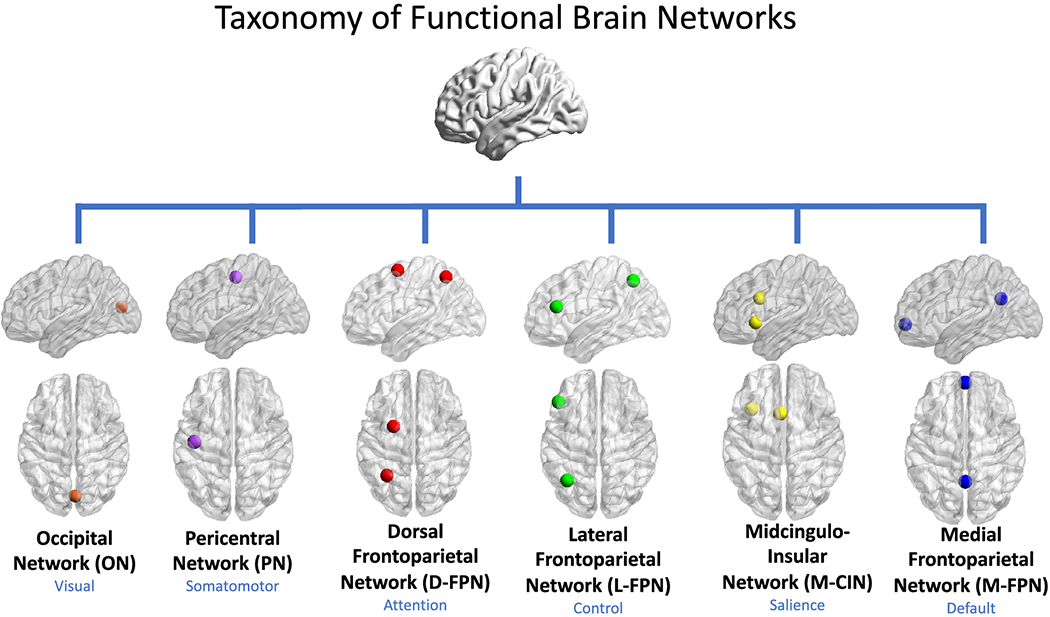
Fig. 25 The midcingulo-insular system stands as the oldest, the primal scaffold upon which all later networks were draped. Before there was fine motor control, before there was deliberative planning or executive function, there was the insula—an ancient sentinel of interoception, regulating the body’s hidden symphony of autonomic rhythms. It is here, in the depths of the salience network, that vertebrates first learned to detect the signals of survival: pain, hunger, temperature, and the visceral stirrings of self-preservation. The midcingulate cortex, though more evolved than its limbic predecessors, still bears the signature of this foundational system—tasked with evaluating effort, action, and adversity. This is the neural network that bridges raw sensation with decision, the fulcrum of attention-switching, ensuring that the organism responds to what matters in the moment. The other networks arrived later, layered refinements upon this ancient core. The pericentral system, with its precise somatomotor control, is an invention of mammals, honed in primates to craft tools and wield symbols. The dorsal stream, a navigator of goals, emerged with complex movement and spatial reasoning. The lateral system, seat of abstraction and executive function, belongs to the neocortical expansion of higher mammals, where foresight and flexibility reign. And the medial network, weaving self-regulation into the fabric of cognition, belongs to the default mode, where identity and reflection consolidate. But beneath them all, the midcingulo-insular remains—the oldest sentinel of salience, the network that does not think but knows, the one that ensures existence before action, before reason, before anything else.#
The first sequence, Nihilism to Integration, traces a trajectory of stakeholder convergence. Nihilism, as a failure to integrate, emerges when interactions falter: a professor hoards IRB-approved donor data, an analyst’s Python script sits unused, or a patient’s voice is sidelined. Deconstruction kicks in as stakeholders challenge this isolation—perhaps a student pushes for open data sharing on GitHub. Perspective arises when they see their roles interlink: the federal employee’s NHANES controls complement the professor’s donor stats. Awareness sparks collaboration—an analyst and care provider brainstorm the app’s inputs. Reconstruction unites their efforts, coding the .csv file with beta coefficients, and Integration binds them into the app’s ecosystem, where a patient’s choice reflects the professor’s data, the analyst’s model, and the administrator’s oversight. Here, interactions evolve from disconnection to a shared mission, forging a functional whole.
“Lens,” the second sequence, is the web app itself—a QR-coded nexus of stakeholder interplay. Patients interact by selecting demographics via drop-down menus, their inputs shaping the curves (baseline vs. nephrectomy). Analysts tweak the back end—JavaScript, HTML, and variance-covariance matrices—ensuring the 95% CIs reflect uncertainty (e.g., sparse data for an 85-year-old donor). Professors, as principal investigators, validate the Cox regression outputs, while administrators secure IRB approval, enabling data flow. Care providers counsel patients using the app’s visuals, and federal employees provide NHANES baselines. This Lens thrives on multidirectional exchange: each stakeholder’s action—coding, inputting, interpreting—ripples through the system, creating a dynamic hub where interactions crystallize into informed consent and decision-making.
Fragmented to United, the third sequence, mirrors the binary choice stakeholders navigate together. Fragmentation reigns when interactions are disjointed: a patient fears ESRD, unaware of the analyst’s risk estimates; a department hoards resources, ignoring the student’s plea for data access. The app’s two curves unify these perspectives—patients see their risk alongside population controls, care providers align with analysts’ outputs, and professors bridge academic silos with federal datasets. This interaction is a negotiation of trust: the patient’s uncertainty meets the analyst’s precision, the administrator’s rules enable the professor’s research. United, they converge on a decision, each stakeholder’s contribution harmonized by the Lens, turning isolated efforts into a collective outcome.
The fourth sequence, Hate to Negotiate to Trust, captures the emotional and transactional interplay among stakeholders. “Hate” surfaces as friction: patients dread perioperative death, analysts clash with professors over model assumptions, or administrators resist sharing sensitive data. Negotiation unfolds as they barter stakes—a patient weighs donating against recipient benefit, a care provider balances risk with waitlist impact, and an analyst compromises with a federal employee for NHANES access. Trust emerges when interactions stabilize: the patient trusts the app’s curves, the professor trusts the analyst’s code, and the administrator trusts the IRB process. These exchanges, fraught then fruitful, show stakeholders navigating adversity—adverse outcomes, ethical dilemmas, data disputes—toward a shared reliance, with the app as their mediator.
Cacophony to Symphony, the fifth sequence, amplifies the sensory and collaborative din of stakeholder interactions. Cacophony erupts from their clashing inputs: patients voice perioperative fears, students juggle coursework with app testing, professors demand rigor, and analysts wrestle with noisy data (e.g., 30-year mortality risks). “Outside” shifts focus to external players—federal employees or distant departments—whose NHANES data or policies stir the pot. “Emotion” internalizes this chaos: a patient’s anxiety, a care provider’s empathy, an analyst’s frustration. “Inside” sees stakeholders process it via the app, refining inputs into curves, and “Symphony” harmonizes their efforts—a patient decides, a professor publishes, an administrator approves. This sequence reveals interactions as a chaotic symphony, resolved through iterative dialogue and the Lens’s synthesis.
These stakeholder interactions—spanning disconnection to unity—mirror broader ecosystems. In a startup, founders, coders, and clients clash then cohere; in a classroom, teachers, students, and parents negotiate learning. The nephrectomy app shows how a tool can orchestrate this: patients drive demand, analysts supply models, professors lend credibility, and administrators gatekeep, all orbiting the Lens. Beyond medicine, this dynamic scales to any decision—career shifts, policy votes—where stakeholders’ tensions fuel integration. The app, born from a GitHub script, proves ecosystems live through interaction: messy, vital, and, when aligned, transformative.
Show code cell source
import numpy as np
import matplotlib.pyplot as plt
import networkx as nx

# Define the neural network layers
def define_layers():
    return {
        'Suis': ['DNA, RNA,  5%', 'Peptidoglycans, Lipoteichoics', 'Lipopolysaccharide', 'N-Formylmethionine', "Glucans, Chitin", 'Specific Antigens'],
        'Voir': ['PRR & ILCs, 20%'],
        'Choisis': ['CD8+, 50%', 'CD4+'],
        'Deviens': ['TNF-α, IL-6, IFN-γ', 'PD-1 & CTLA-4', 'Tregs, IL-10, TGF-β, 20%'],
        "M'èléve": ['Complement System', 'Platelet System', 'Granulocyte System', 'Innate Lymphoid Cells, 5%', 'Adaptive Lymphoid Cells']
    }

# Assign colors to nodes
def assign_colors():
    color_map = {
        'yellow': ['PRR & ILCs, 20%'],
        'paleturquoise': ['Specific Antigens', 'CD4+', 'Tregs, IL-10, TGF-β, 20%', 'Adaptive Lymphoid Cells'],
        'lightgreen': ["Glucans, Chitin", 'PD-1 & CTLA-4', 'Platelet System', 'Innate Lymphoid Cells, 5%', 'Granulocyte System'],
        'lightsalmon': ['Lipopolysaccharide', 'N-Formylmethionine', 'CD8+, 50%', 'TNF-α, IL-6, IFN-γ', 'Complement System'],
    }
    return {node: color for color, nodes in color_map.items() for node in nodes}

# Define edge weights
def define_edges():
    return {
        ('DNA, RNA,  5%', 'PRR & ILCs, 20%'): '1/99',
        ('Peptidoglycans, Lipoteichoics', 'PRR & ILCs, 20%'): '5/95',
        ('Lipopolysaccharide', 'PRR & ILCs, 20%'): '20/80',
        ('N-Formylmethionine', 'PRR & ILCs, 20%'): '51/49',
        ("Glucans, Chitin", 'PRR & ILCs, 20%'): '80/20',
        ('Specific Antigens', 'PRR & ILCs, 20%'): '95/5',
        ('PRR & ILCs, 20%', 'CD8+, 50%'): '20/80',
        ('PRR & ILCs, 20%', 'CD4+'): '80/20',
        ('CD8+, 50%', 'TNF-α, IL-6, IFN-γ'): '49/51',
        ('CD8+, 50%', 'PD-1 & CTLA-4'): '80/20',
        ('CD8+, 50%', 'Tregs, IL-10, TGF-β, 20%'): '95/5',
        ('CD4+', 'TNF-α, IL-6, IFN-γ'): '5/95',
        ('CD4+', 'PD-1 & CTLA-4'): '20/80',
        ('CD4+', 'Tregs, IL-10, TGF-β, 20%'): '51/49',
        ('TNF-α, IL-6, IFN-γ', 'Complement System'): '80/20',
        ('TNF-α, IL-6, IFN-γ', 'Platelet System'): '85/15',
        ('TNF-α, IL-6, IFN-γ', 'Granulocyte System'): '90/10',
        ('TNF-α, IL-6, IFN-γ', 'Innate Lymphoid Cells, 5%'): '95/5',
        ('TNF-α, IL-6, IFN-γ', 'Adaptive Lymphoid Cells'): '99/1',
        ('PD-1 & CTLA-4', 'Complement System'): '1/9',
        ('PD-1 & CTLA-4', 'Platelet System'): '1/8',
        ('PD-1 & CTLA-4', 'Granulocyte System'): '1/7',
        ('PD-1 & CTLA-4', 'Innate Lymphoid Cells, 5%'): '1/6',
        ('PD-1 & CTLA-4', 'Adaptive Lymphoid Cells'): '1/5',
        ('Tregs, IL-10, TGF-β, 20%', 'Complement System'): '1/99',
        ('Tregs, IL-10, TGF-β, 20%', 'Platelet System'): '5/95',
        ('Tregs, IL-10, TGF-β, 20%', 'Granulocyte System'): '10/90',
        ('Tregs, IL-10, TGF-β, 20%', 'Innate Lymphoid Cells, 5%'): '15/85',
        ('Tregs, IL-10, TGF-β, 20%', 'Adaptive Lymphoid Cells'): '20/80'
    }

# Define edges to be highlighted in black
def define_black_edges():
    return {
        ('PRR & ILCs, 20%', 'CD4+'): '80/20',
        ('CD4+', 'TNF-α, IL-6, IFN-γ'): '5/95',
        ('CD4+', 'PD-1 & CTLA-4'): '20/80',
        ('CD4+', 'Tregs, IL-10, TGF-β, 20%'): '51/49',
    }

# Calculate node positions
def calculate_positions(layer, x_offset):
    y_positions = np.linspace(-len(layer) / 2, len(layer) / 2, len(layer))
    return [(x_offset, y) for y in y_positions]

# Create and visualize the neural network graph
def visualize_nn():
    layers = define_layers()
    colors = assign_colors()
    edges = define_edges()
    black_edges = define_black_edges()

    G = nx.DiGraph()
    pos = {}
    node_colors = []

    # Create mapping from original node names to numbered labels
    mapping = {}
    counter = 1
    for layer in layers.values():
        for node in layer:
            mapping[node] = f"{counter}. {node}"
            counter += 1

    # Add nodes with new numbered labels and assign positions
    for i, (layer_name, nodes) in enumerate(layers.items()):
        positions = calculate_positions(nodes, x_offset=i * 2)
        for node, position in zip(nodes, positions):
            new_node = mapping[node]
            G.add_node(new_node, layer=layer_name)
            pos[new_node] = position
            node_colors.append(colors.get(node, 'lightgray'))

    # Add edges with updated node labels
    edge_colors = []
    for (source, target), weight in edges.items():
        if source in mapping and target in mapping:
            new_source = mapping[source]
            new_target = mapping[target]
            G.add_edge(new_source, new_target, weight=weight)
            edge_colors.append('black' if (source, target) in black_edges else 'lightgrey')

    # Draw the graph
    plt.figure(figsize=(12, 8))
    edges_labels = {(u, v): d["weight"] for u, v, d in G.edges(data=True)}

    nx.draw(
        G, pos, with_labels=True, node_color=node_colors, edge_color=edge_colors,
        node_size=3000, font_size=9, connectionstyle="arc3,rad=0.2"
    )
    nx.draw_networkx_edge_labels(G, pos, edge_labels=edges_labels, font_size=8)
    plt.title("OPRAH™: Connectome", fontsize=18)
    plt.show()

# Run the visualization
visualize_nn()
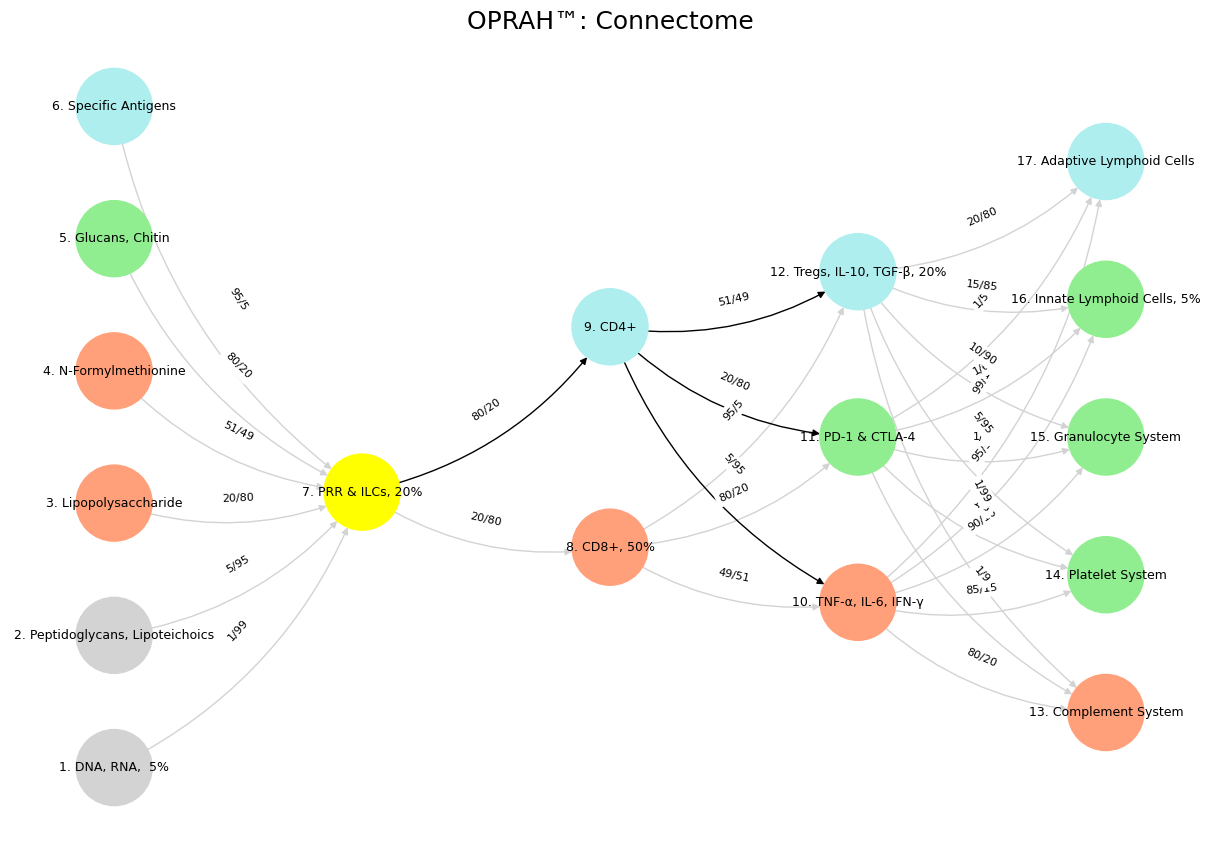

Fig. 26 The Human Connectome. Beyond the cellular intelligence of genome, exposome, transcriptome, proteome, metabolome. We grapple with servers, client, agent, decentralization, mesh. Metaphors from the nervous system, immune system, artificial intelligence, and C-suit principal-agent affairs find convergence in this space. Herein we interrogate the current landscape to identify five macro-scale brain network naming schemes and conventions utilized in the literature, ignoring inconsistencies while pointing out convergence across disparate human endeavors to delineate the noise/signal ratio as guide, avoiding confusion as a matter of design.#