Duality#
The five sequences—Nihilism through Integration, Lens, Fragmented to United, Hate to Trust, and Cacophony to Symphony—take on a striking new depth with the context of ecosystem integration and navigation within the scientific enterprise of clinical research. Here, Nihilism isn’t just existential despair but a failure to integrate, a breakdown in the cohesion of an ecosystem like clinical research, where students, professors, care providers, patients, analysts, administrators, and academic departments operate. This ecosystem thrives on integration, and its navigation—captured in sequences 2 through 5—reflects the dynamic interplay of these actors as they wrestle with data, decisions, and outcomes. The speculative essay now pivots to a tangible case: a simple web app designed to aid decision-making in living donor nephrectomy, which becomes a microcosm of this broader ecosystem and its potential to generalize beyond medicine.
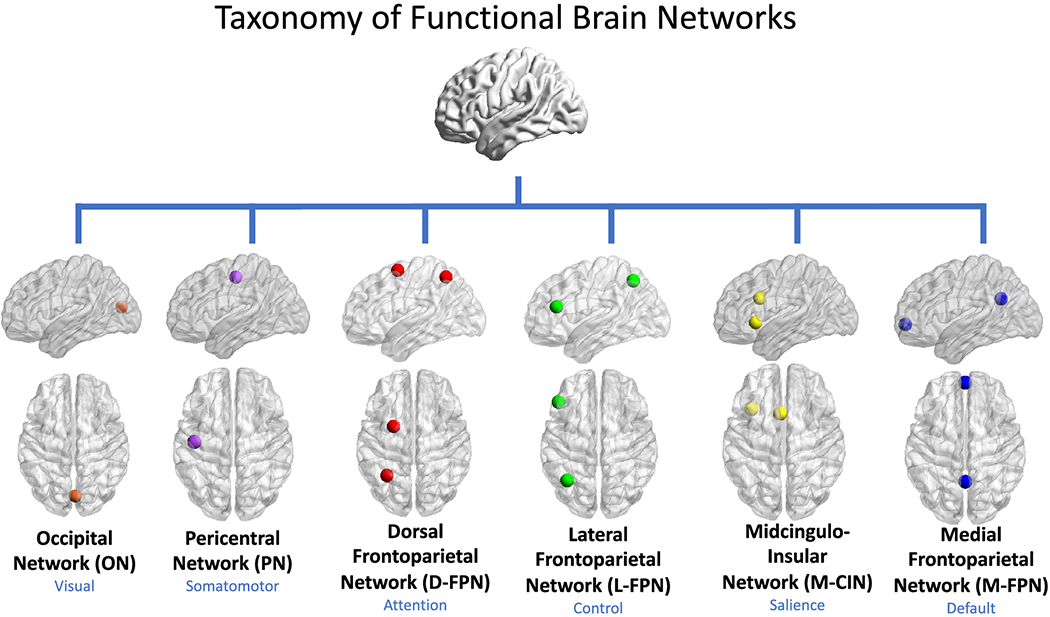
Fig. 17 Pattern recognition and speculation are instinctive and vestigual aspects of our complex neural, endocrine, and immune systems.#
Consider the first sequence: Nihilism as a failure to integrate sets the stage. In clinical research, this might manifest as siloed data, disconnected stakeholders, or unshared insights—think of an analyst’s script languishing in isolation or a professor’s IRB-approved donor data never reaching a federal employee with NHANES control population access. Deconstruction follows, breaking down these barriers, perhaps through open collaboration on GitHub. Perspective emerges as stakeholders step back to see the system’s gaps, leading to Awareness of how integration could align their efforts. Reconstruction builds a unified approach—say, merging Cox regression outputs with real-world inputs—and Integration delivers a cohesive tool, like the web app, binding the ecosystem into a functional whole. This arc mirrors the app’s genesis: a Stata or Python script evolves into a shared, interactive platform, uniting disparate players.
The second sequence, “Lens,” crystallizes as the web app itself, accessed via QR code. It’s the worldview, the interface through which this ecosystem is navigated—a digital constitution blending JavaScript, HTML, and a .csv file with beta coefficients, variance-covariance matrices, and baseline cumulative incidence functions from Cox regression. Hosted on GitHub Pages, it’s a focal point for students entering demographic data, analysts tweaking models, or patients weighing risks. By generating two Kaplan-Meier curves—one for baseline (no donation) and one for the decision (living donor nephrectomy), each with 95% confidence intervals—it empowers end-users to visualize outcomes like perioperative mortality or 30-year ESRD risk. The “Lens” isn’t static; its interactivity via drop-down menus reflects the ecosystem’s fluidity, while its uncertainty—wild CIs for an 85-year-old donor due to sparse data—captures the informativeness and limits of scientific consensus.
Signal/Wave
Transducer
Electronic
Processor/Receiver
Wave/Signal
The third sequence, Fragmented to United, becomes the choice between the two curves—a stark binary at the heart of the app. It’s the ecosystem in miniature: fragmented data and perspectives (donor vs. control, short-term vs. long-term) unified by the user’s decision. This mirrors the broader scientific enterprise, where disparate datasets (NHANES controls, donor registries) and actors (researchers, clinicians) converge into a single, actionable insight. The app’s simplicity belies its power: by presenting a clear fork in the road, it bridges the ecosystem’s divides, turning raw numbers into a shared narrative of risk and benefit.
The fourth sequence—Hate, Negotiate, Trust—maps onto the transactional stakes of this decision. “Hate” could be the adverse outcomes feared by the donor: perioperative death, hospitalization, or long-term ESRD risk. “Negotiate” embodies the trade-offs—balancing those risks against desired outcomes like the recipient’s survival or reducing the deceased donor waitlist by one. “Trust” emerges as the informed consent process, where patients, guided by the app’s curves, accept uncertainty and rely on the ecosystem’s integrity. This relational arc reflects the push-pull of clinical research: stakeholders navigate mistrust (incomplete data, wide CIs) toward a collective faith in shared tools and evidence, all facilitated by the “Lens.”
Finally, Cacophony to Symphony encapsulates the wide-ranging noise and resolution of this ecosystem. “Cacophony” is the initial chaos—missed workdays, perioperative fears, 30-year mortality projections, and the clamor of stakeholder voices from students to administrators. “Outside” shifts focus to external data (NHANES, donor registries), while “Emotion” internalizes the decision’s weight for patients and providers. “Inside” reflects the app’s synthesis of this complexity into user-specific curves, and “Symphony” is the harmony of an informed choice, aligning the ecosystem’s discordant inputs into a coherent outcome. This sequence captures the app’s role in taming the scientific enterprise’s messiness, from raw .csv files to a patient’s quiet moment of clarity.
This case—living donor nephrectomy—explodes into a broader vision. The app’s framework generalizes to any fork in the road: a student choosing a career, a policymaker weighing interventions, or a parent deciding on a child’s treatment. The ecosystem shifts—analysts become advisors, professors become mentors, patients become decision-makers—but the pattern holds. Nihilism’s failure to integrate haunts every unconnected system; the “Lens” (a tool, a QR code) illuminates the path; Fragmented unites into a binary choice; Hate-Negotiate-Trust negotiates stakes; and Cacophony resolves into Symphony. Beyond medicine, this is about decision-making itself—how ecosystems, scientific or otherwise, navigate uncertainty to empower action. The app’s simplicity, born from a GitHub collaboration, hints at a revolution: integration as the antidote to chaos, with a humble web tool as its beating heart.
Show code cell source
import numpy as np
import matplotlib.pyplot as plt
import networkx as nx

# Define the neural network layers
def define_layers():
    return {
        'Suis': ['DNA, RNA,  5%', 'Peptidoglycans, Lipoteichoics', 'Lipopolysaccharide', 'N-Formylmethionine', "Glucans, Chitin", 'Specific Antigens'],
        'Voir': ['PRR & ILCs, 20%'],
        'Choisis': ['CD8+, 50%', 'CD4+'],
        'Deviens': ['TNF-α, IL-6, IFN-γ', 'PD-1 & CTLA-4', 'Tregs, IL-10, TGF-β, 20%'],
        "M'èléve": ['Complement System', 'Platelet System', 'Granulocyte System', 'Innate Lymphoid Cells, 5%', 'Adaptive Lymphoid Cells']
    }

# Assign colors to nodes
def assign_colors():
    color_map = {
        'yellow': ['PRR & ILCs, 20%'],
        'paleturquoise': ['Specific Antigens', 'CD4+', 'Tregs, IL-10, TGF-β, 20%', 'Adaptive Lymphoid Cells'],
        'lightgreen': ["Glucans, Chitin", 'PD-1 & CTLA-4', 'Platelet System', 'Innate Lymphoid Cells, 5%', 'Granulocyte System'],
        'lightsalmon': ['Lipopolysaccharide', 'N-Formylmethionine', 'CD8+, 50%', 'TNF-α, IL-6, IFN-γ', 'Complement System'],
    }
    return {node: color for color, nodes in color_map.items() for node in nodes}

# Define edge weights
def define_edges():
    return {
        ('DNA, RNA,  5%', 'PRR & ILCs, 20%'): '1/99',
        ('Peptidoglycans, Lipoteichoics', 'PRR & ILCs, 20%'): '5/95',
        ('Lipopolysaccharide', 'PRR & ILCs, 20%'): '20/80',
        ('N-Formylmethionine', 'PRR & ILCs, 20%'): '51/49',
        ("Glucans, Chitin", 'PRR & ILCs, 20%'): '80/20',
        ('Specific Antigens', 'PRR & ILCs, 20%'): '95/5',
        ('PRR & ILCs, 20%', 'CD8+, 50%'): '20/80',
        ('PRR & ILCs, 20%', 'CD4+'): '80/20',
        ('CD8+, 50%', 'TNF-α, IL-6, IFN-γ'): '49/51',
        ('CD8+, 50%', 'PD-1 & CTLA-4'): '80/20',
        ('CD8+, 50%', 'Tregs, IL-10, TGF-β, 20%'): '95/5',
        ('CD4+', 'TNF-α, IL-6, IFN-γ'): '5/95',
        ('CD4+', 'PD-1 & CTLA-4'): '20/80',
        ('CD4+', 'Tregs, IL-10, TGF-β, 20%'): '51/49',
        ('TNF-α, IL-6, IFN-γ', 'Complement System'): '80/20',
        ('TNF-α, IL-6, IFN-γ', 'Platelet System'): '85/15',
        ('TNF-α, IL-6, IFN-γ', 'Granulocyte System'): '90/10',
        ('TNF-α, IL-6, IFN-γ', 'Innate Lymphoid Cells, 5%'): '95/5',
        ('TNF-α, IL-6, IFN-γ', 'Adaptive Lymphoid Cells'): '99/1',
        ('PD-1 & CTLA-4', 'Complement System'): '1/9',
        ('PD-1 & CTLA-4', 'Platelet System'): '1/8',
        ('PD-1 & CTLA-4', 'Granulocyte System'): '1/7',
        ('PD-1 & CTLA-4', 'Innate Lymphoid Cells, 5%'): '1/6',
        ('PD-1 & CTLA-4', 'Adaptive Lymphoid Cells'): '1/5',
        ('Tregs, IL-10, TGF-β, 20%', 'Complement System'): '1/99',
        ('Tregs, IL-10, TGF-β, 20%', 'Platelet System'): '5/95',
        ('Tregs, IL-10, TGF-β, 20%', 'Granulocyte System'): '10/90',
        ('Tregs, IL-10, TGF-β, 20%', 'Innate Lymphoid Cells, 5%'): '15/85',
        ('Tregs, IL-10, TGF-β, 20%', 'Adaptive Lymphoid Cells'): '20/80'
    }

# Define edges to be highlighted in black
def define_black_edges():
    return {
        ('Tregs, IL-10, TGF-β, 20%', 'Complement System'): '1/99',
        ('Tregs, IL-10, TGF-β, 20%', 'Platelet System'): '5/95',
        ('Tregs, IL-10, TGF-β, 20%', 'Granulocyte System'): '10/90',
        ('Tregs, IL-10, TGF-β, 20%', 'Innate Lymphoid Cells, 5%'): '15/85',
        ('Tregs, IL-10, TGF-β, 20%', 'Adaptive Lymphoid Cells'): '20/80'
    }

# Calculate node positions
def calculate_positions(layer, x_offset):
    y_positions = np.linspace(-len(layer) / 2, len(layer) / 2, len(layer))
    return [(x_offset, y) for y in y_positions]

# Create and visualize the neural network graph
def visualize_nn():
    layers = define_layers()
    colors = assign_colors()
    edges = define_edges()
    black_edges = define_black_edges()

    G = nx.DiGraph()
    pos = {}
    node_colors = []

    # Create mapping from original node names to numbered labels
    mapping = {}
    counter = 1
    for layer in layers.values():
        for node in layer:
            mapping[node] = f"{counter}. {node}"
            counter += 1

    # Add nodes with new numbered labels and assign positions
    for i, (layer_name, nodes) in enumerate(layers.items()):
        positions = calculate_positions(nodes, x_offset=i * 2)
        for node, position in zip(nodes, positions):
            new_node = mapping[node]
            G.add_node(new_node, layer=layer_name)
            pos[new_node] = position
            node_colors.append(colors.get(node, 'lightgray'))

    # Add edges with updated node labels
    edge_colors = []
    for (source, target), weight in edges.items():
        if source in mapping and target in mapping:
            new_source = mapping[source]
            new_target = mapping[target]
            G.add_edge(new_source, new_target, weight=weight)
            edge_colors.append('black' if (source, target) in black_edges else 'lightgrey')

    # Draw the graph
    plt.figure(figsize=(12, 8))
    edges_labels = {(u, v): d["weight"] for u, v, d in G.edges(data=True)}

    nx.draw(
        G, pos, with_labels=True, node_color=node_colors, edge_color=edge_colors,
        node_size=3000, font_size=9, connectionstyle="arc3,rad=0.2"
    )
    nx.draw_networkx_edge_labels(G, pos, edge_labels=edges_labels, font_size=8)
    plt.title("OPRAH™: Aristotle, Monumental, SN", fontsize=18)
    plt.show()

# Run the visualization
visualize_nn()
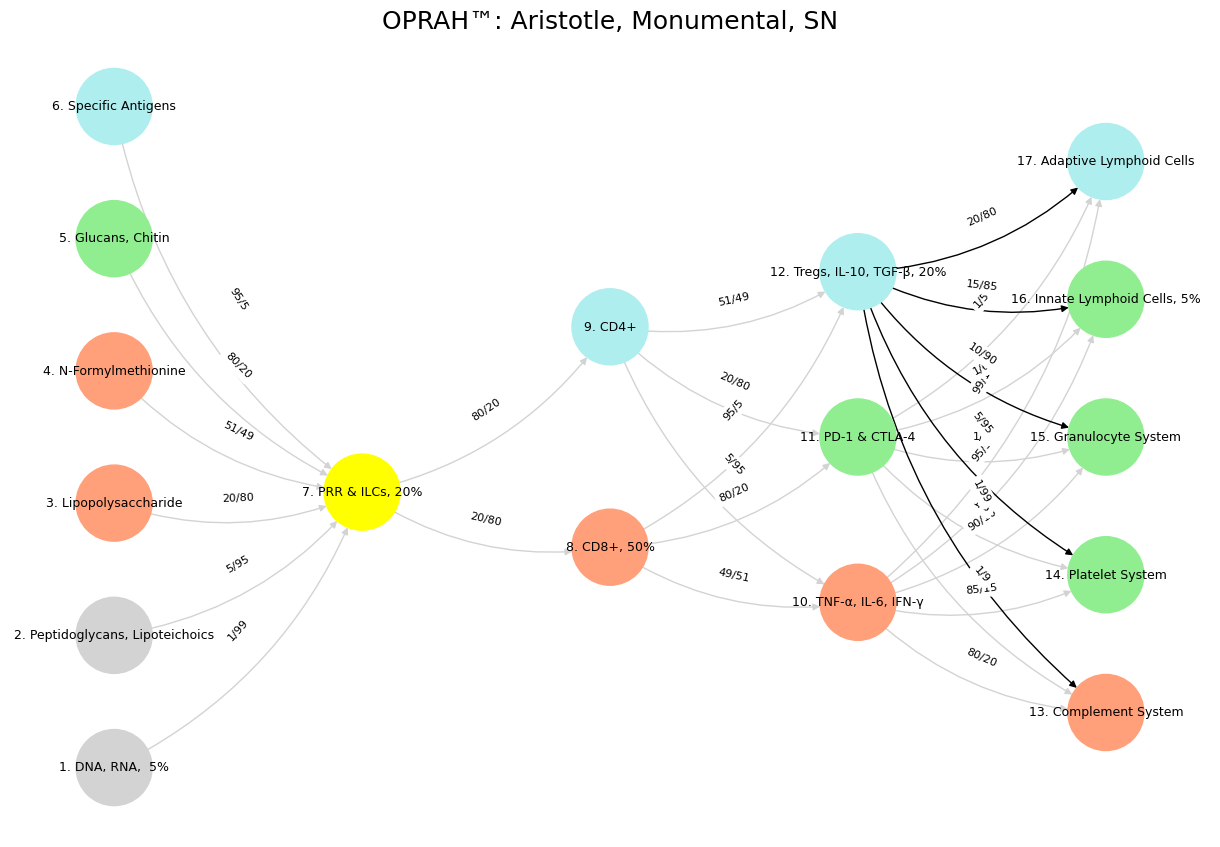
Fig. 18 Dynamic Capability. The monumental will align adversarial TNF-α, IL-6, IFN-γ with antigens from pathogens of “ancient grudge”, a new mutiny with antiquarian roots. But it will also tokenize PD-1 & CTLA-4 with specific, emergent antigens, while also reappraising “self” to ensure no rogue viral and malignant elements remain unnoticéd.#
Show code cell source
import pygame
import sys
import random

# Initialize Pygame
pygame.init()

# Constants
SCREEN_WIDTH = 800
SCREEN_HEIGHT = 600
PADDLE_WIDTH = 20
PADDLE_HEIGHT = 100
BALL_SIZE = 20
BRICK_WIDTH = 40
BRICK_HEIGHT = 20
BRICK_COLUMNS = 5
BRICK_ROWS = 30  # 600 / 20 = 30 rows to span screen height
PADDLE_SPEED = 5
BALL_SPEED = 5
TARGET_SCORE = 50

# Colors
BLACK = (0, 0, 0)
WHITE = (255, 255, 255)
RED = (255, 100, 100)
GREEN = (100, 255, 100)
BLUE = (100, 100, 255)

# Set up display
screen = pygame.display.set_mode((SCREEN_WIDTH, SCREEN_HEIGHT))
pygame.display.set_caption("Break-Pong")
clock = pygame.time.Clock()

# Paddle class
class Paddle:
    def __init__(self, x, y):
        self.x = x
        self.y = y
        self.width = PADDLE_WIDTH
        self.height = PADDLE_HEIGHT
        self.speed = PADDLE_SPEED

    def move(self, up=True):
        if up:
            self.y -= self.speed
        else:
            self.y += self.speed
        # Keep paddle within screen bounds
        self.y = max(0, min(SCREEN_HEIGHT - self.height, self.y))

    def draw(self):
        pygame.draw.rect(screen, WHITE, (self.x, self.y, self.width, self.height))

# Ball class
class Ball:
    def __init__(self):
        self.reset()
        self.size = BALL_SIZE

    def move(self):
        self.x += self.vel_x
        self.y += self.vel_y

    def reset(self):
        self.x = SCREEN_WIDTH // 2
        self.y = SCREEN_HEIGHT // 2
        self.vel_x = random.choice([-1, 1]) * BALL_SPEED
        self.vel_y = random.choice([-1, 1]) * BALL_SPEED
        self.last_hit = None  # Tracks which paddle last hit the ball

    def draw(self):
        pygame.draw.circle(screen, WHITE, (int(self.x), int(self.y)), self.size // 2)

# Brick class
class Brick:
    def __init__(self, x, y):
        self.x = x
        self.y = y
        self.width = BRICK_WIDTH
        self.height = BRICK_HEIGHT
        self.color = random.choice([RED, GREEN, BLUE])
        self.intact = True

    def draw(self):
        if self.intact:
            pygame.draw.rect(screen, self.color, (self.x, self.y, self.width, self.height))

# Particle class for visual effects
class Particle:
    def __init__(self, x, y):
        self.x = x
        self.y = y
        self.size = random.randint(2, 5)
        self.vel_x = random.uniform(-2, 2)
        self.vel_y = random.uniform(-2, 2)
        self.life = 30  # Frames until particle disappears
        self.color = random.choice([RED, GREEN, BLUE])

    def update(self):
        self.x += self.vel_x
        self.y += self.vel_y
        self.life -= 1

    def draw(self):
        if self.life > 0:
            alpha = int((self.life / 30) * 255)  # Fade out effect
            surface = pygame.Surface((self.size, self.size), pygame.SRCALPHA)
            pygame.draw.circle(surface, (*self.color, alpha), (self.size // 2, self.size // 2), self.size // 2)
            screen.blit(surface, (int(self.x), int(self.y)))

# Collision detection functions
def ball_collides_with_paddle(ball, paddle):
    return (ball.x - ball.size // 2 < paddle.x + paddle.width and
            ball.x + ball.size // 2 > paddle.x and
            ball.y - ball.size // 2 < paddle.y + paddle.height and
            ball.y + ball.size // 2 > paddle.y)

def ball_collides_with_brick(ball, brick):
    if not brick.intact:
        return False
    return (ball.x - ball.size // 2 < brick.x + brick.width and
            ball.x + ball.size // 2 > brick.x and
            ball.y - ball.size // 2 < brick.y + brick.height and
            ball.y + ball.size // 2 > brick.y)

# Initialize game objects
left_paddle = Paddle(50, SCREEN_HEIGHT // 2 - PADDLE_HEIGHT // 2)
right_paddle = Paddle(SCREEN_WIDTH - 50 - PADDLE_WIDTH, SCREEN_HEIGHT // 2 - PADDLE_HEIGHT // 2)
ball = Ball()

# Create central brick wall
bricks = []
brick_start_x = SCREEN_WIDTH // 2 - (BRICK_COLUMNS * BRICK_WIDTH) // 2
for col in range(BRICK_COLUMNS):
    for row in range(BRICK_ROWS):
        bricks.append(Brick(brick_start_x + col * BRICK_WIDTH, row * BRICK_HEIGHT))

# Scores and particles
left_score = 0
right_score = 0
particles = []

# Game loop
running = True
while running:
    # Event handling
    for event in pygame.event.get():
        if event.type == pygame.QUIT:
            running = False

    # Paddle movement
    keys = pygame.key.get_pressed()
    if keys[pygame.K_w]:
        left_paddle.move(up=True)
    if keys[pygame.K_s]:
        left_paddle.move(up=False)
    if keys[pygame.K_UP]:
        right_paddle.move(up=True)
    if keys[pygame.K_DOWN]:
        right_paddle.move(up=False)

    # Update ball
    ball.move()

    # Ball collisions with top/bottom walls
    if ball.y - ball.size // 2 <= 0 or ball.y + ball.size // 2 >= SCREEN_HEIGHT:
        ball.vel_y = -ball.vel_y

    # Ball collisions with paddles
    if ball_collides_with_paddle(ball, left_paddle):
        ball.vel_x = abs(ball.vel_x)  # Ensure ball moves right
        ball.last_hit = 'left'
    elif ball_collides_with_paddle(ball, right_paddle):
        ball.vel_x = -abs(ball.vel_x)  # Ensure ball moves left
        ball.last_hit = 'right'

    # Ball collisions with bricks
    for brick in bricks:
        if ball_collides_with_brick(ball, brick):
            brick.intact = False
            ball.vel_x = -ball.vel_x
            # Add particles
            for _ in range(5):
                particles.append(Particle(brick.x + brick.width // 2, brick.y + brick.height // 2))
            # Award points
            if ball.last_hit == 'left':
                left_score += 1
            elif ball.last_hit == 'right':
                right_score += 1

    # Ball off screen
    if ball.x - ball.size // 2 <= 0:
        right_score += 5
        ball.reset()
    elif ball.x + ball.size // 2 >= SCREEN_WIDTH:
        left_score += 5
        ball.reset()

    # Update particles
    for particle in particles[:]:
        particle.update()
        if particle.life <= 0:
            particles.remove(particle)

    # Draw everything
    screen.fill(BLACK)
    for brick in bricks:
        brick.draw()
    left_paddle.draw()
    right_paddle.draw()
    ball.draw()
    for particle in particles:
        particle.draw()

    # Draw scores
    font = pygame.font.Font(None, 36)
    left_text = font.render(f"Left: {left_score}", True, WHITE)
    right_text = font.render(f"Right: {right_score}", True, WHITE)
    screen.blit(left_text, (50, 20))
    screen.blit(right_text, (SCREEN_WIDTH - 150, 20))

    # Check for game over
    if left_score >= TARGET_SCORE or right_score >= TARGET_SCORE:
        winner = "Left" if left_score >= TARGET_SCORE else "Right"
        game_over_text = font.render(f"{winner} Wins!", True, WHITE)
        screen.blit(game_over_text, (SCREEN_WIDTH // 2 - 50, SCREEN_HEIGHT // 2))
        pygame.display.flip()
        pygame.time.wait(3000)
        running = False

    pygame.display.flip()
    clock.tick(60)

# Cleanup
pygame.quit()
sys.exit()
Show code cell output
An exception has occurred, use %tb to see the full traceback.

SystemExit
The Kernel crashed while executing code in the current cell or a previous cell.

Please review the code in the cell(s) to identify a possible cause of the failure.

Click <a href='https://aka.ms/vscodeJupyterKernelCrash'>here</a> for more info.

View Jupyter <a href='command:jupyter.viewOutput'>log</a> for further details.