
Transvaluation#
Fig. 19 What Exactly is Identity. A node may represent goats (in general) and another sheep (in general). But the identity of any specific animal (not its species) is a network. For this reason we might have a “black sheep”, distinct in certain ways – perhaps more like a goat than other sheep. But that’s all dull stuff. Mistaken identity is often the fuel of comedy, usually when the adversarial is mistaken for the cooperative or even the transactional.#
Show code cell source
import numpy as np
import matplotlib.pyplot as plt
import networkx as nx

# Define the neural network fractal
def define_layers():
    return {
        'World': ['Particles-Compression', 'Vibration-Particulate.Matter', 'Ear, Cerebellum-Georientation', 'Harmonic Series-Agency.Phonology', 'Space-Verb.Syntax', 'Time-Object.Meaning', ], # Resources
        'Perception': ['Rhythm, Pockets'], # Needs
        'Agency': ['Open-Nomiddleman', 'Closed-Trusted'], # Costs
        'Generative': ['Ratio-Weaponized', 'Competition-Tokenized', 'Odds-Monopolized'], # Means
        'Physical': ['Volatile-Revolutionary', 'Unveiled-Resentment',  'Freedom-Dance in Chains', 'Exuberant-Jubilee', 'Stable-Conservative'] # Ends
    }

# Assign colors to nodes
def assign_colors():
    color_map = {
        'yellow': ['Rhythm, Pockets'],
        'paleturquoise': ['Time-Object.Meaning', 'Closed-Trusted', 'Odds-Monopolized', 'Stable-Conservative'],
        'lightgreen': ['Space-Verb.Syntax', 'Competition-Tokenized', 'Exuberant-Jubilee', 'Freedom-Dance in Chains', 'Unveiled-Resentment'],
        'lightsalmon': [
            'Ear, Cerebellum-Georientation', 'Harmonic Series-Agency.Phonology', 'Open-Nomiddleman',
            'Ratio-Weaponized', 'Volatile-Revolutionary'
        ],
    }
    return {node: color for color, nodes in color_map.items() for node in nodes}

# Calculate positions for nodes
def calculate_positions(layer, x_offset):
    y_positions = np.linspace(-len(layer) / 2, len(layer) / 2, len(layer))
    return [(x_offset, y) for y in y_positions]

# Create and visualize the neural network graph
def visualize_nn():
    layers = define_layers()
    colors = assign_colors()
    G = nx.DiGraph()
    pos = {}
    node_colors = []

    # Add nodes and assign positions
    for i, (layer_name, nodes) in enumerate(layers.items()):
        positions = calculate_positions(nodes, x_offset=i * 2)
        for node, position in zip(nodes, positions):
            G.add_node(node, layer=layer_name)
            pos[node] = position
            node_colors.append(colors.get(node, 'lightgray'))  # Default color fallback

    # Add edges (automated for consecutive layers)
    layer_names = list(layers.keys())
    for i in range(len(layer_names) - 1):
        source_layer, target_layer = layer_names[i], layer_names[i + 1]
        for source in layers[source_layer]:
            for target in layers[target_layer]:
                G.add_edge(source, target)

    # Draw the graph
    plt.figure(figsize=(12, 8))
    nx.draw(
        G, pos, with_labels=True, node_color=node_colors, edge_color='gray',
        node_size=3000, font_size=8, connectionstyle="arc3,rad=0.2"
    )
    plt.title("Music", fontsize=13)
    plt.show()

# Run the visualization
visualize_nn()
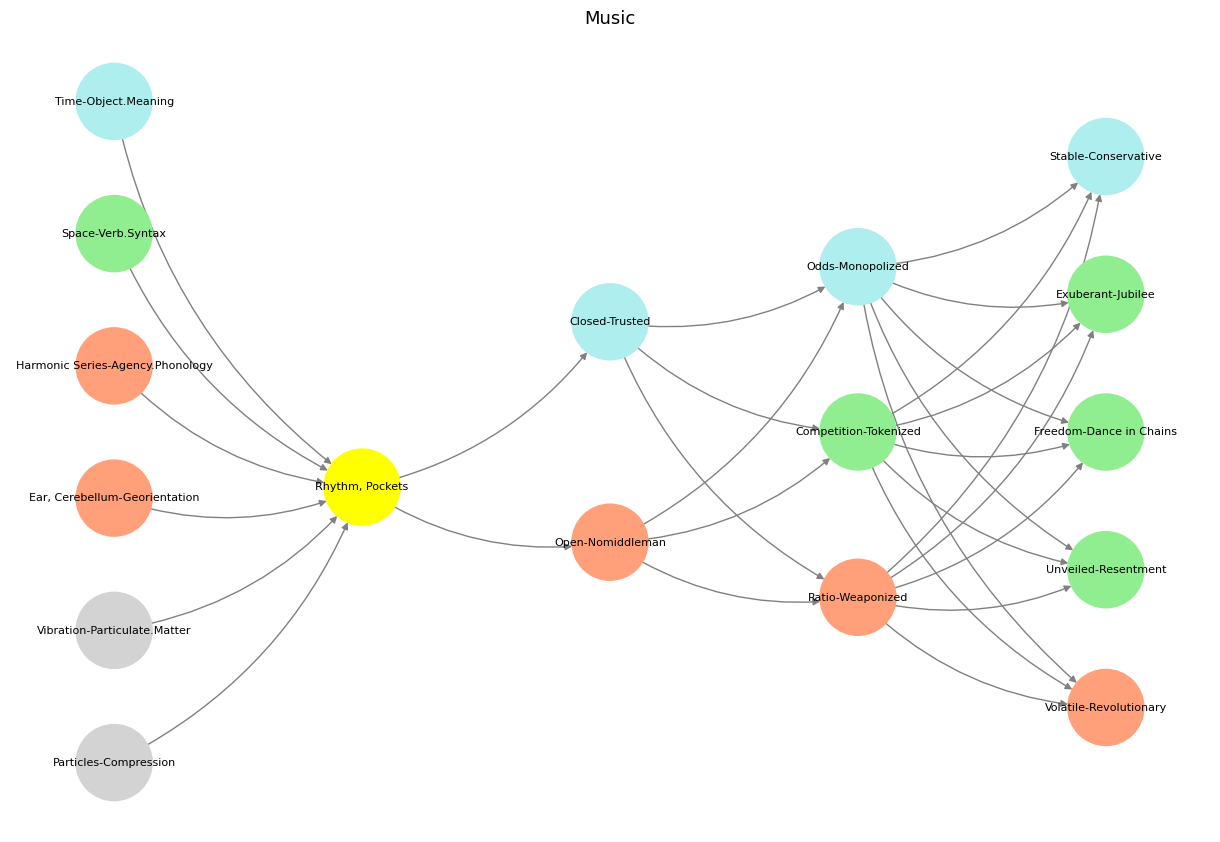
Fig. 20 Nvidia vs. Music. APIs between Nvidias CUDA & their clients (yellowstone node: G1 & G2) are here replaced by the ear-drum & vestibular apparatus. The chief enterprise in music is listening and responding (N1, N2, N3) as well as coordination and syncronization with others too (N4 & N5). Whether its classical or improvisational and participatory, a massive and infinite combinatorial landscape is available for composer, maestro, performer, audience. And who are we to say what exactly music optimizes?#