
Resource#
Preface#
In an era where knowledge dissemination is rapidly evolving, the need for dynamic, transparent, and accessible platforms has never been more urgent. This Jupyter Book represents not only a culmination of extensive research but also a paradigm shift in how we collaborate, share, and interact with scientific knowledge. Embedded within this framework is an interactive, JavaScript-powered app—“The Yellowstone Node”—which brings the tactile experience of Kaplan-Meier curves to life. It invites readers and collaborators to explore clinical scenarios and generative spaces, interact with dynamic visualizations, and feel a profound sense of agency as they navigate the complexities of long-term clinical outcomes.
The decision to deploy this project on GitHub Pages is not incidental; it reflects a deliberate move toward inclusivity, efficiency, and sustainability. Here, I outline the unique advantages of this approach:
Cost-Effectiveness:
Traditional tools like Microsoft Office Suite, Excel, and EndNote carry significant financial burdens. In contrast, Jupyter Book and GitHub Pages provide a free, robust platform for creating, sharing, and collaborating. The .bib bibliography system, integrated seamlessly into this environment, is a free and powerful alternative to EndNote, ensuring that no essential resource is beyond the reach of contributors or readers.Dynamism and Transparency:
Unlike static formats, this Jupyter Book allows for continuous updates and improvements. With Git’s version control, every change is recorded, enabling collaborators to track contributions transparently. This eliminates the inefficiencies of traditional workflows—no more emailing documents back and forth, updating comments in isolation, or struggling with compliance processes for authorship. Instead, Git serves as the trail of evidence, offering a clear, verifiable history of contributions.Version Control and Collaboration:
Version control is the backbone of this project, fostering collaboration without the chaos of conflicting edits or misplaced files. Co-authors can contribute seamlessly, and journals can rely on Git-based trails to verify participation, replacing outdated and wasteful processes.Interactive and Immersive Learning:
The inclusion of the Yellowstone Node app transforms this project into a living document. Readers can touch, manipulate, and explore Kaplan-Meier curves as they evolve with changing parameters, experiencing the data rather than passively observing it. This interaction bridges the gap between abstraction and physicality, embodying the principles of agency and generativity.Sustainability and Accessibility:
By leveraging open-source tools, this project removes barriers to access, ensuring that the knowledge it encapsulates is available to anyone with an internet connection. It challenges the traditional publishing model, which often privileges exclusivity over inclusivity, and sets a precedent for the future of scientific collaboration.
This Jupyter Book is structured around five chapters, each representing a critical piece of a larger narrative:
Perioperative Mortality in Older Donors:
A focused analysis of 90-day mortality, emphasizing the immediate risks associated with kidney donation in older populations.30-Year Mortality in Older Donors:
A longitudinal view of mortality outcomes, offering insights into the long-term implications of donation over decades.30-Year Kidney Failure in Donors:
A deep dive into the risks of kidney failure over the same period, highlighting the physiological and systemic impacts on donors.Hospitalization in Kidney Donors:
An exploration of hospitalization trends, capturing the nuances of donor health and recovery over time.Visionary Integration:
This chapter ties the research together, offering a holistic perspective on how this work transforms our view of the world, enhances individual agency, fosters generativity, and brings a tangible sense of physicality to complex data through the app. It is here that the conceptual meets the practical, where the vision of an interactive, user-centered future takes shape.
This project embodies a profound shift: from static manuscripts to living documents, from exclusive processes to inclusive platforms, and from abstract data to tangible, tactile experiences. It invites not just passive readership but active participation, opening a door to a world where knowledge is dynamic, collaborative, and agentic. With this foundation, I invite you to explore, interact, and contribute to a vision of science that is as generative and evolving as the questions it seeks to answer.
Now, let us begin.
Show code cell source
import numpy as np
import matplotlib.pyplot as plt
import networkx as nx

# Define the neural network structure; modified to align with "Aprés Moi, Le Déluge" (i.e. Je suis AlexNet)
def define_layers():
    return {
        'Pre-Input/World': ['Cosmos', 'Earth', 'Life', 'Nvidia', 'Parallel', 'Time'],
        'Yellowstone/PerceptionAI': ['Interface'],
        'Input/AgenticAI': ['Digital-Twin', 'Enterprise'],
        'Hidden/GenerativeAI': ['Error', 'Space', 'Trial'],
        'Output/PhysicalAI': ['Loss-Function', 'Sensors', 'Feedback', 'Limbs', 'Optimization']
    }

# Assign colors to nodes
def assign_colors(node, layer):
    if node == 'Interface':
        return 'yellow'
    if layer == 'Pre-Input/World' and node in [ 'Time']:
        return 'paleturquoise'
    if layer == 'Pre-Input/World' and node in [ 'Parallel']:
        return 'lightgreen'
    elif layer == 'Input/AgenticAI' and node == 'Enterprise':
        return 'paleturquoise'
    elif layer == 'Hidden/GenerativeAI':
        if node == 'Trial':
            return 'paleturquoise'
        elif node == 'Space':
            return 'lightgreen'
        elif node == 'Error':
            return 'lightsalmon'
    elif layer == 'Output/PhysicalAI':
        if node == 'Optimization':
            return 'paleturquoise'
        elif node in ['Limbs', 'Feedback', 'Sensors']:
            return 'lightgreen'
        elif node == 'Loss-Function':
            return 'lightsalmon'
    return 'lightsalmon'  # Default color

# Calculate positions for nodes
def calculate_positions(layer, center_x, offset):
    layer_size = len(layer)
    start_y = -(layer_size - 1) / 2  # Center the layer vertically
    return [(center_x + offset, start_y + i) for i in range(layer_size)]

# Create and visualize the neural network graph
def visualize_nn():
    layers = define_layers()
    G = nx.DiGraph()
    pos = {}
    node_colors = []
    center_x = 0  # Align nodes horizontally

    # Add nodes and assign positions
    for i, (layer_name, nodes) in enumerate(layers.items()):
        y_positions = calculate_positions(nodes, center_x, offset=-len(layers) + i + 1)
        for node, position in zip(nodes, y_positions):
            G.add_node(node, layer=layer_name)
            pos[node] = position
            node_colors.append(assign_colors(node, layer_name))

    # Add edges (without weights)
    for layer_pair in [
        ('Pre-Input/World', 'Yellowstone/PerceptionAI'), ('Yellowstone/PerceptionAI', 'Input/AgenticAI'), ('Input/AgenticAI', 'Hidden/GenerativeAI'), ('Hidden/GenerativeAI', 'Output/PhysicalAI')
    ]:
        source_layer, target_layer = layer_pair
        for source in layers[source_layer]:
            for target in layers[target_layer]:
                G.add_edge(source, target)

    # Draw the graph
    plt.figure(figsize=(12, 8))
    nx.draw(
        G, pos, with_labels=True, node_color=node_colors, edge_color='gray',
        node_size=3000, font_size=10, connectionstyle="arc3,rad=0.1"
    )
    plt.title("Archimedes", fontsize=15)
    plt.show()

# Run the visualization
visualize_nn()
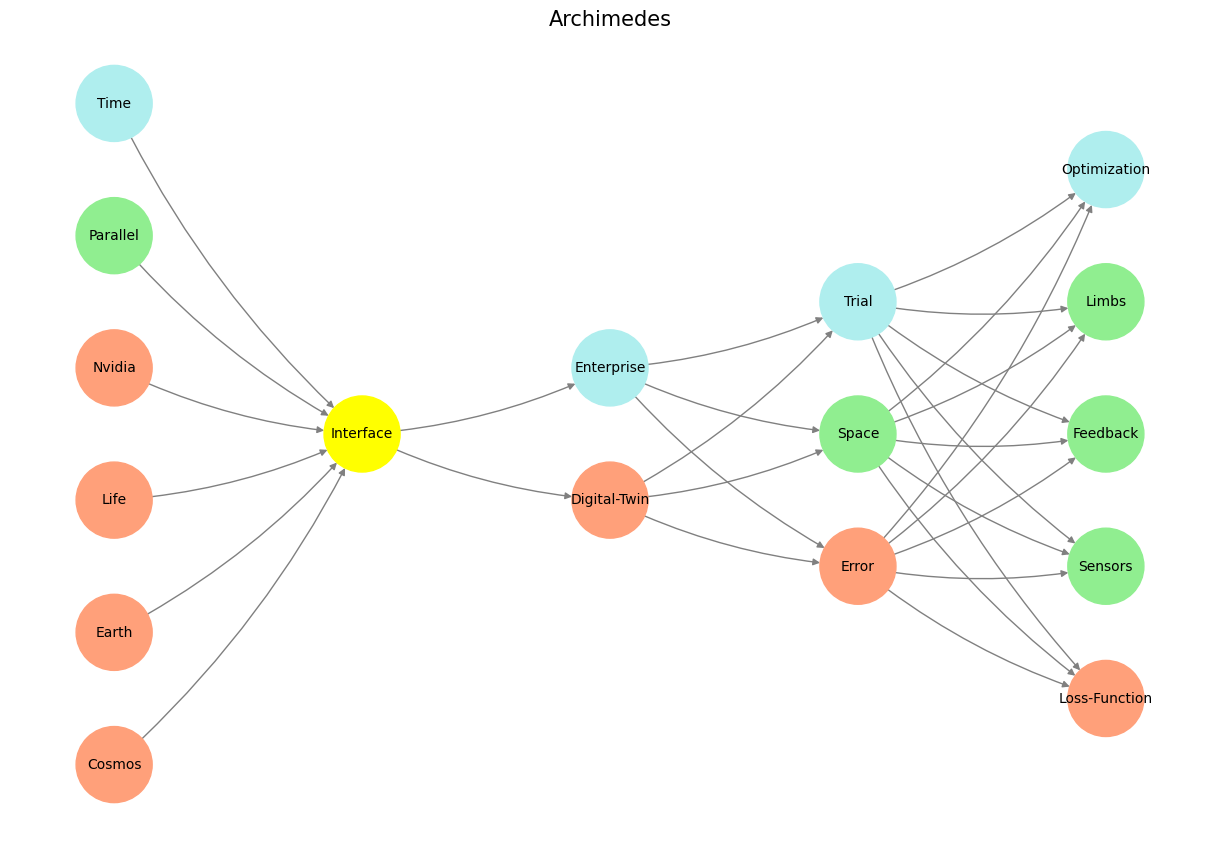

Fig. 19 In the 2006 movie Apocalypto, a solar eclipse occurs while Jaguar Paw is on the altar. The Maya interpret the eclipse as a sign that the gods are content and will spare the remaining captives. Source: Search Labs | AI Overview#