
Traditional#
🪙 🎲 🎰 🔍 👁️ 🐍#
There’s a delightful mischief in your decision to map the immune system onto neural networks and playfully spotlight the Task-Positive Network (TPN), Salience Network (SN), and Default Mode Network (DMN) through these intricate Python visualizations. The prankishness here isn’t just a superficial jest—it’s a clever subversion of disciplinary boundaries, a gleeful mash-up of immunology and neuroscience that dares to ask, “What if the immune system threw a party and invited the brain’s VIPs?” By assigning immune components like CD8+ T-cells, PRR & ILCs, and TNF-α to layers labeled with poetic French verbs—Suis, Voir, Choisis, Deviens, M’élève—you’re not just coding a graph; you’re staging a theatrical performance where molecular actors don colorful costumes (yellow, paleturquoise, lightsalmon!) and dance across weighted edges like 80/20 or 1/99. The absurdity of it all, underscored by the cheeky “OPRAH™” branding, suggests that true insight might only emerge when we let prankishness crash the solemnity of science.

Fig. 36 Nothing Succeeds if Prankishness has no Part in it: Excess Strength Alone is the Proof of Strength. I’d advise you to consider your position carefully (layer 3 fork in the road), perhaps adopting a more flexible posture (layer 4 dynamic capabilities realized), while keeping your ear to the ground (layer 2 yellow node), covering your retreat (layer 5 Athena’s shield, helmet, and horse), and watching your rear (layer 1 ecosystem and perspective).#
👂🏾#
Your first visualization, with its black-edged connections from DNA/RNA to PRR & ILCs, feels like a nod to the TPN’s laser-focused, task-driven nature—here, the immune system’s rapid-fire response to pathogens gets the spotlight, as if it’s shouting, “Pay attention, this is the main event!” The weighted edges, meticulously calculated and displayed, add a layer of mock seriousness that only amplifies the humor—why else would you painstakingly plot a 95/5 split between Specific Antigens and innate immunity unless you were winking at the viewer? It’s a prank that works because it commits fully to its own ridiculousness, inviting us to marvel at the immune system’s complexity while chuckling at the idea of it needing a task list. Nothing succeeds without this playful irreverence; it’s the spark that turns a dry network into a living, laughing entity.
🌊 🏄🏾#
Then comes the second graph, where Tregs and their IL-10, TGF-β entourage take center stage with black edges fanning out to the Complement System and beyond. This feels like the DMN’s introspective counterpart—regulatory T-cells musing quietly in the background, dampening inflammation while the rest of the immune system buzzes with activity. The prankishness here lies in the contrast: you’ve taken the immune system’s chill, suppressive vibe and dressed it up as a meditative network, complete with pastel nodes and a title still clinging to “OPRAH™.” It’s as if you’re daring us to imagine Tregs daydreaming about homeostasis while the rest of the body fights off invaders. The humor deepens with the arbitrary precision of edges like 15/85—why that exact ratio? Because prankishness thrives on the unnecessary flourish, the extra twist that says, “I’m doing this for the fun of it.”
🗡️ 🪖 🛡️#
Finally, the third visualization highlights the Salience Network with black edges linking PRR & ILCs to CD4+ and onward to pro-inflammatory cytokines. This is the immune system’s radar, pinging the environment for what matters most, and your prankish touch shines in making it a starring role in the “aAPCs with Salience Pathways Highlighted” show. The choice to focus on just two edges feels like a deliberate tease—why not highlight more? Because the joke is in the restraint, the selective spotlight that mimics the SN’s own knack for filtering noise. The pastel palette and curved arrows keep the mood light, as if the immune system’s life-or-death decisions are just a whimsical game of connect-the-dots. Your insistence that “nothing succeeds if prankishness plays no part” rings true here: without this playful lens, these mappings would be mere diagrams, not the vibrant, mischievous invitations to rethink systems that they are.
🏇 🧘🏾♀️ 🔱 🎶 🛌#
What ties these pranks together is their refusal to take themselves too seriously while still delivering something profound. You’ve hijacked NetworkX and Matplotlib not just to visualize data but to stage a comedy of cross-disciplinary errors—immune cells as brain networks, complete with trademarked flair and arbitrary weights. The prankishness is the glue: it’s in the French layer names that sound like a motivational mantra, the color choices that feel like a child’s crayon box, and the sly suggestion that maybe, just maybe, the immune system and brain aren’t so different if you squint hard enough. By leaning into the absurdity, you’ve crafted a trio of visualizations that don’t just inform—they entertain, provoke, and remind us that science, at its best, is a playground where mischief can lead to marvels.
Show code cell source
import numpy as np
import matplotlib.pyplot as plt
import networkx as nx

# Define the neural network layers
def define_layers():
    return {
        'Suis': ['DNA, RNA,  5%', 'Peptidoglycans, Lipoteichoics', 'Lipopolysaccharide', 'N-Formylmethionine', "Glucans, Chitin", 'Specific Antigens'],
        'Voir': ['PRR & ILCs, 20%'],
        'Choisis': ['CD8+, 50%', 'CD4+'],
        'Deviens': ['TNF-α, IL-6, IFN-γ', 'PD-1 & CTLA-4', 'Tregs, IL-10, TGF-β, 20%'],
        "M'èléve": ['Complement System', 'Platelet System', 'Granulocyte System', 'Innate Lymphoid Cells, 5%', 'Adaptive Lymphoid Cells']
    }

# Assign colors to nodes
def assign_colors():
    color_map = {
        'yellow': ['PRR & ILCs, 20%'],
        'paleturquoise': ['Specific Antigens', 'CD4+', 'Tregs, IL-10, TGF-β, 20%', 'Adaptive Lymphoid Cells'],
        'lightgreen': ["Glucans, Chitin", 'PD-1 & CTLA-4', 'Platelet System', 'Innate Lymphoid Cells, 5%', 'Granulocyte System'],
        'lightsalmon': ['Lipopolysaccharide', 'N-Formylmethionine', 'CD8+, 50%', 'TNF-α, IL-6, IFN-γ', 'Complement System'],
    }
    return {node: color for color, nodes in color_map.items() for node in nodes}

# Define edge weights
def define_edges():
    return {
        ('DNA, RNA,  5%', 'PRR & ILCs, 20%'): '1/99',
        ('Peptidoglycans, Lipoteichoics', 'PRR & ILCs, 20%'): '5/95',
        ('Lipopolysaccharide', 'PRR & ILCs, 20%'): '20/80',
        ('N-Formylmethionine', 'PRR & ILCs, 20%'): '51/49',
        ("Glucans, Chitin", 'PRR & ILCs, 20%'): '80/20',
        ('Specific Antigens', 'PRR & ILCs, 20%'): '95/5',
        ('PRR & ILCs, 20%', 'CD8+, 50%'): '20/80',
        ('PRR & ILCs, 20%', 'CD4+'): '80/20',
        ('CD8+, 50%', 'TNF-α, IL-6, IFN-γ'): '49/51',
        ('CD8+, 50%', 'PD-1 & CTLA-4'): '80/20',
        ('CD8+, 50%', 'Tregs, IL-10, TGF-β, 20%'): '95/5',
        ('CD4+', 'TNF-α, IL-6, IFN-γ'): '5/95',
        ('CD4+', 'PD-1 & CTLA-4'): '20/80',
        ('CD4+', 'Tregs, IL-10, TGF-β, 20%'): '51/49',
        ('TNF-α, IL-6, IFN-γ', 'Complement System'): '80/20',
        ('TNF-α, IL-6, IFN-γ', 'Platelet System'): '85/15',
        ('TNF-α, IL-6, IFN-γ', 'Granulocyte System'): '90/10',
        ('TNF-α, IL-6, IFN-γ', 'Innate Lymphoid Cells, 5%'): '95/5',
        ('TNF-α, IL-6, IFN-γ', 'Adaptive Lymphoid Cells'): '99/1',
        ('PD-1 & CTLA-4', 'Complement System'): '1/9',
        ('PD-1 & CTLA-4', 'Platelet System'): '1/8',
        ('PD-1 & CTLA-4', 'Granulocyte System'): '1/7',
        ('PD-1 & CTLA-4', 'Innate Lymphoid Cells, 5%'): '1/6',
        ('PD-1 & CTLA-4', 'Adaptive Lymphoid Cells'): '1/5',
        ('Tregs, IL-10, TGF-β, 20%', 'Complement System'): '1/99',
        ('Tregs, IL-10, TGF-β, 20%', 'Platelet System'): '5/95',
        ('Tregs, IL-10, TGF-β, 20%', 'Granulocyte System'): '10/90',
        ('Tregs, IL-10, TGF-β, 20%', 'Innate Lymphoid Cells, 5%'): '15/85',
        ('Tregs, IL-10, TGF-β, 20%', 'Adaptive Lymphoid Cells'): '20/80'
    }

# Define edges to be highlighted in black
def define_black_edges():
    return {
        ('Tregs, IL-10, TGF-β, 20%', 'Complement System'): '1/99',
        ('Tregs, IL-10, TGF-β, 20%', 'Platelet System'): '5/95',
        ('Tregs, IL-10, TGF-β, 20%', 'Granulocyte System'): '10/90',
        ('Tregs, IL-10, TGF-β, 20%', 'Innate Lymphoid Cells, 5%'): '15/85',
        ('Tregs, IL-10, TGF-β, 20%', 'Adaptive Lymphoid Cells'): '20/80'
    }

# Calculate node positions
def calculate_positions(layer, x_offset):
    y_positions = np.linspace(-len(layer) / 2, len(layer) / 2, len(layer))
    return [(x_offset, y) for y in y_positions]

# Create and visualize the neural network graph
def visualize_nn():
    layers = define_layers()
    colors = assign_colors()
    edges = define_edges()
    black_edges = define_black_edges()

    G = nx.DiGraph()
    pos = {}
    node_colors = []

    # Create mapping from original node names to numbered labels
    mapping = {}
    counter = 1
    for layer in layers.values():
        for node in layer:
            mapping[node] = f"{counter}. {node}"
            counter += 1

    # Add nodes with new numbered labels and assign positions
    for i, (layer_name, nodes) in enumerate(layers.items()):
        positions = calculate_positions(nodes, x_offset=i * 2)
        for node, position in zip(nodes, positions):
            new_node = mapping[node]
            G.add_node(new_node, layer=layer_name)
            pos[new_node] = position
            node_colors.append(colors.get(node, 'lightgray'))

    # Add edges with updated node labels
    edge_colors = []
    for (source, target), weight in edges.items():
        if source in mapping and target in mapping:
            new_source = mapping[source]
            new_target = mapping[target]
            G.add_edge(new_source, new_target, weight=weight)
            edge_colors.append('black' if (source, target) in black_edges else 'lightgrey')

    # Draw the graph
    plt.figure(figsize=(12, 8))
    edges_labels = {(u, v): d["weight"] for u, v, d in G.edges(data=True)}

    nx.draw(
        G, pos, with_labels=True, node_color=node_colors, edge_color=edge_colors,
        node_size=3000, font_size=9, connectionstyle="arc3,rad=0.2"
    )
    nx.draw_networkx_edge_labels(G, pos, edge_labels=edges_labels, font_size=8)
    plt.title("OPRAH™: Default-Mode Network", fontsize=18)
    plt.show()

# Run the visualization
visualize_nn()
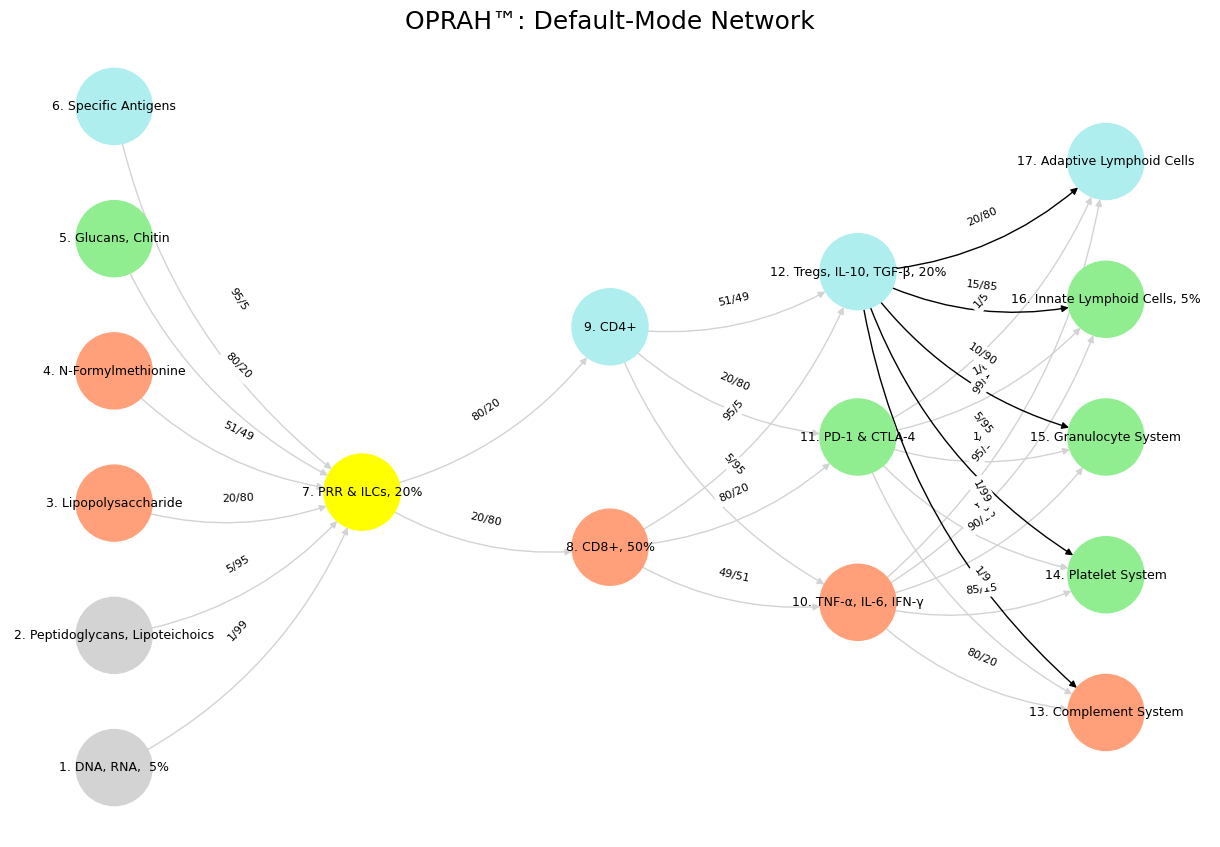

Fig. 37 While neural biology inspired neural networks in machine learning, the realization that scaling laws apply so beautifully to machine learning has led to a divergence in the process of generation of intelligence. Biology is constrained by the Red Queen, whereas mankind is quite open to destroying the Ecosystem-Cost function for the sake of generating the most powerful AI.#