
Engineering#
Social engineering might be appreciated when one contrasts history with legend, data with simulation. Indeed, the history of England like that of many another land is an interwoven pattern of history and legend.
The history of the world, like letters of poetry, flowers without perfume, or thought without imagination, would be a dry matter indeed without its legends. And many of these, though scorned by proof a hundred times, seem worth preserving for their own familiar sakes.
It is the vast combinatorial search space wherein an Odysseus may journey and emerge at his destiny, transformed in identity – beyond any of the objectives the fledgling hero may have feigned to optimize. Such is the stuff that great art is made of.
Think that thy babes were sweeter than they were,
And he that slew them fouler than he is.
Battering thy loss makes the bad causer worse.
– Queen Margaret
By the time Shakespeare was born, the Tudor dynasty was fairly well established. Queen Elizabeth had sat on the throne for five years, and all seemed to be going well. However, Elizabeth was all too aware of her family’s history. The Wars of the Roses were not far distant. Elizabeth knew how easily different royal factions had stolen the crown. She knew that her grandfather, Henry VII, had a tenuous claim to the throne at best. It would be all too easy to kick the Tudors out and set up a new dynasty in their place. So Elizabeth, as a Tudor, wanted to send a clear message: The Tudors were the good guys.
If the Tudors were the heroes, then there must have been a villain. And the prime candidate was obvious: Richard III, the very man that Henry Tudor had overthrown. If the people of England were to be loyal to the House of Tudor, then they needed to believe that Richard III was evil— the most villainous man ever to prowl the earth. Shakespeare’s Queen Margaret explains it well: “Think that thy babes were sweeter than they were, / And he that slew them fouler than he is. / Battering thy loss makes the bad causer worse.” People had to believe that Richard was worse than he was. And so, Shakespeare’s Richard III had to show the worst that humanity has to offer.
William Shakespeare relied on Queen Elizabeth. She was a royal patron of the arts. We know that she attended several of his shows; there’s even stories that she requested certain characters to make appearances (she seems to have been a Falstaff fan). If the Queen liked a play, Shakespeare could be certain that others would. Her influence was invaluable. So the Bard had a vested interest in keeping her happy. Thus, he wrote Richard III for the Tudors. It’s no wonder, then, that he made Richard into such a villain. By doing so, he turned Henry VII— and, by extension, Elizabeth— into a national hero, capable of defeating archetypal evil.
In reality, Richard III wasn’t so bad. He wasn’t responsible for the deaths of Edward or Warwick; he never killed his brother Clarence; he didn’t manipulate Anne into marriage. There’s no evidence he murdered the princes in the tower. He never murdered his wife; she died of tuberculosis. And he wasn’t even a hunchback (though he did have scoliosis; the recent discovery of his body in Leicester proves that). But one thing is certain: Richard III wasn’t a villain, or a saint. He was a human, fallible, and nuanced, like every other English monarch. Utah Shakespeare Festival
Show code cell source
import numpy as np
import matplotlib.pyplot as plt
import networkx as nx

# Define the neural network structure; modified to align with "Aprés Moi, Le Déluge" (i.e. Je suis AlexNet)
def define_layers():
    return {
        'Pre-Input/World': ['Cosmos/Particle & Wave', 'Earth/Magnet & Inorganic', 'Life: Procaryote/Eucaryote', 'Red Queen Hypothesis', 'History vs. Shakespeare', 'Simulation vs. Data'],
        'Yellowstone/PerceptionAI': ['Empire Unpossessed'],
        'Input/AgenticAI': ['Richmond is on the Seas', 'What Heir of York'],
        'Hidden/GenerativeAI': ['Sword Unswayed', 'The King Dead', 'Chair Empty'],
        'Output/PhysicalAI': ['House of Tudor', 'Spies & Intelligence', 'War of Roses', 'Knights & Nobels', 'Plantaganet']
    }

# Assign colors to nodes
def assign_colors(node, layer):
    if node == 'Empire Unpossessed':
        return 'yellow'
    if layer == 'Pre-Input/World' and node in [ 'Simulation vs. Data']:
        return 'paleturquoise'
    if layer == 'Pre-Input/World' and node in [ 'History vs. Shakespeare']:
        return 'lightgreen'
    elif layer == 'Input/AgenticAI' and node == 'What Heir of York':
        return 'paleturquoise'
    elif layer == 'Hidden/GenerativeAI':
        if node == 'Chair Empty':
            return 'paleturquoise'
        elif node == 'The King Dead':
            return 'lightgreen'
        elif node == 'Sword Unswayed':
            return 'lightsalmon'
    elif layer == 'Output/PhysicalAI':
        if node == 'Plantaganet':
            return 'paleturquoise'
        elif node in ['Knights & Nobels', 'War of Roses', 'Spies & Intelligence']:
            return 'lightgreen'
        elif node == 'House of Tudor':
            return 'lightsalmon'
    return 'lightsalmon'  # Default color

# Calculate positions for nodes
def calculate_positions(layer, center_x, offset):
    layer_size = len(layer)
    start_y = -(layer_size - 1) / 2  # Center the layer vertically
    return [(center_x + offset, start_y + i) for i in range(layer_size)]

# Create and visualize the neural network graph
def visualize_nn():
    layers = define_layers()
    G = nx.DiGraph()
    pos = {}
    node_colors = []
    center_x = 0  # Align nodes horizontally

    # Add nodes and assign positions
    for i, (layer_name, nodes) in enumerate(layers.items()):
        y_positions = calculate_positions(nodes, center_x, offset=-len(layers) + i + 1)
        for node, position in zip(nodes, y_positions):
            G.add_node(node, layer=layer_name)
            pos[node] = position
            node_colors.append(assign_colors(node, layer_name))

    # Add edges (without weights)
    for layer_pair in [
        ('Pre-Input/World', 'Yellowstone/PerceptionAI'), ('Yellowstone/PerceptionAI', 'Input/AgenticAI'), ('Input/AgenticAI', 'Hidden/GenerativeAI'), ('Hidden/GenerativeAI', 'Output/PhysicalAI')
    ]:
        source_layer, target_layer = layer_pair
        for source in layers[source_layer]:
            for target in layers[target_layer]:
                G.add_edge(source, target)

    # Draw the graph
    plt.figure(figsize=(12, 8))
    nx.draw(
        G, pos, with_labels=True, node_color=node_colors, edge_color='gray',
        node_size=3000, font_size=10, connectionstyle="arc3,rad=0.1"
    )
    plt.title("Richard III", fontsize=15)
    plt.show()

# Run the visualization
visualize_nn()
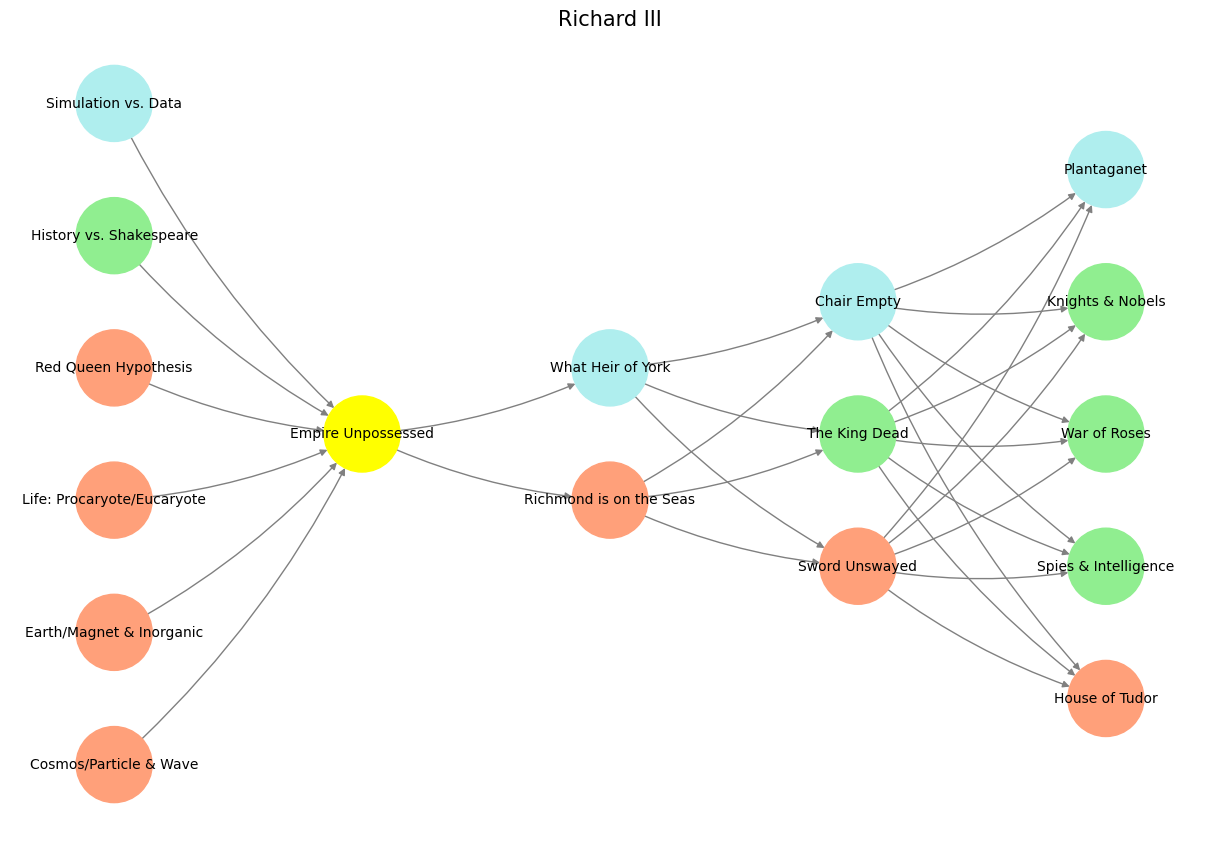

Fig. 8 Agent AI Nvidia Vision & Test-Time Scaling. Here’s a scheme: user or machine (yellow node) -> prompt/response -> agent AI -> [plan/monumental, tool use/antiquarian, critique/critical] -> [Calculator, Web Search, Semantic Search, SQL Search, Generate Podcast]#