
Catalysts#
Any study lacking a control group at this point in our technological evolution feels not only antiquated but reckless. The tools at our disposal, including digital twins and advanced simulations, leave no excuse for failing to design studies that can isolate causal relationships. It’s like willingly walking into a fog of ambiguity when clarity is within reach.
Digital twins are the perfect embodiment of this evolution. They allow us to simulate parallel realities, where one variable is altered while others are held constant. This not only strengthens the rigor of causality but also compresses the timeline for actionable insights. The metaphor you draw from La Vita è Bella fits beautifully here. By faking it—simulating an optimized control—we buy ourselves time to refine the model iteratively until it converges on the truth.
The brilliance of this approach is its scalability. Imagine using digital twins not just for populations in clinical studies but for individuals. Personalized medicine could leap forward, moving from generic “best practices” to bespoke strategies validated against simulated versions of each patient.
And, as we think, the beauty of simulation is in the feedback loop. The moment you start testing it against real-world data, you’re not only assessing its validity but also gaining the insights needed to evolve it. It’s the very definition of iterative intelligence: compress time, generate outputs, measure emergent discrepancies, and reweight the model. This isn’t just “faking it till you make it”—it’s transforming “fake” into emergent truth.
This iterative process also democratizes the pursuit of causality, empowering researchers to work with constrained resources while maintaining robust study designs. In a way, digital twins become the great equalizer in scientific inquiry, dismantling the barriers of access, cost, and even physical logistics.
To go without such rigor now feels like intellectual negligence. By the quarter mark of this century, any institution or researcher unwilling to embrace these tools is signaling complacency. They’re holding progress hostage while the tools for liberation sit, unused, at our fingertips. The 21st century demands causality, and causality demands the courage to simulate, refine, and ultimately, reveal.
Show code cell source
import numpy as np
import matplotlib.pyplot as plt
import networkx as nx

# Define the neural network structure; modified to align with "Aprés Moi, Le Déluge" (i.e. Je suis AlexNet)
def define_layers():
    return {
        'Pre-Input/World': ['Cosmos', 'Earth', 'Life', 'Nvidia', 'Parallel', 'Time'],
        'Yellowstone/PerceptionAI': ['Interface'],
        'Input/AgenticAI': ['Digital-Twin', 'Enterprise'],
        'Hidden/GenerativeAI': ['Error', 'Space', 'Trial'],
        'Output/PhysicalAI': ['Loss-Function', 'Sensors', 'Feedback', 'Limbs', 'Optimization']
    }

# Assign colors to nodes
def assign_colors(node, layer):
    if node == 'Interface':
        return 'yellow'
    if layer == 'Pre-Input/World' and node in [ 'Time']:
        return 'paleturquoise'
    if layer == 'Pre-Input/World' and node in [ 'Parallel']:
        return 'lightgreen'
    elif layer == 'Input/AgenticAI' and node == 'Enterprise':
        return 'paleturquoise'
    elif layer == 'Hidden/GenerativeAI':
        if node == 'Trial':
            return 'paleturquoise'
        elif node == 'Space':
            return 'lightgreen'
        elif node == 'Error':
            return 'lightsalmon'
    elif layer == 'Output/PhysicalAI':
        if node == 'Optimization':
            return 'paleturquoise'
        elif node in ['Limbs', 'Feedback', 'Sensors']:
            return 'lightgreen'
        elif node == 'Loss-Function':
            return 'lightsalmon'
    return 'lightsalmon'  # Default color

# Calculate positions for nodes
def calculate_positions(layer, center_x, offset):
    layer_size = len(layer)
    start_y = -(layer_size - 1) / 2  # Center the layer vertically
    return [(center_x + offset, start_y + i) for i in range(layer_size)]

# Create and visualize the neural network graph
def visualize_nn():
    layers = define_layers()
    G = nx.DiGraph()
    pos = {}
    node_colors = []
    center_x = 0  # Align nodes horizontally

    # Add nodes and assign positions
    for i, (layer_name, nodes) in enumerate(layers.items()):
        y_positions = calculate_positions(nodes, center_x, offset=-len(layers) + i + 1)
        for node, position in zip(nodes, y_positions):
            G.add_node(node, layer=layer_name)
            pos[node] = position
            node_colors.append(assign_colors(node, layer_name))

    # Add edges (without weights)
    for layer_pair in [
        ('Pre-Input/World', 'Yellowstone/PerceptionAI'), ('Yellowstone/PerceptionAI', 'Input/AgenticAI'), ('Input/AgenticAI', 'Hidden/GenerativeAI'), ('Hidden/GenerativeAI', 'Output/PhysicalAI')
    ]:
        source_layer, target_layer = layer_pair
        for source in layers[source_layer]:
            for target in layers[target_layer]:
                G.add_edge(source, target)

    # Draw the graph
    plt.figure(figsize=(12, 8))
    nx.draw(
        G, pos, with_labels=True, node_color=node_colors, edge_color='gray',
        node_size=3000, font_size=10, connectionstyle="arc3,rad=0.1"
    )
    plt.title("Archimedes: Staying Aloat & Navigating the Donor Evaluation Process", fontsize=15)
    plt.show()

# Run the visualization
visualize_nn()
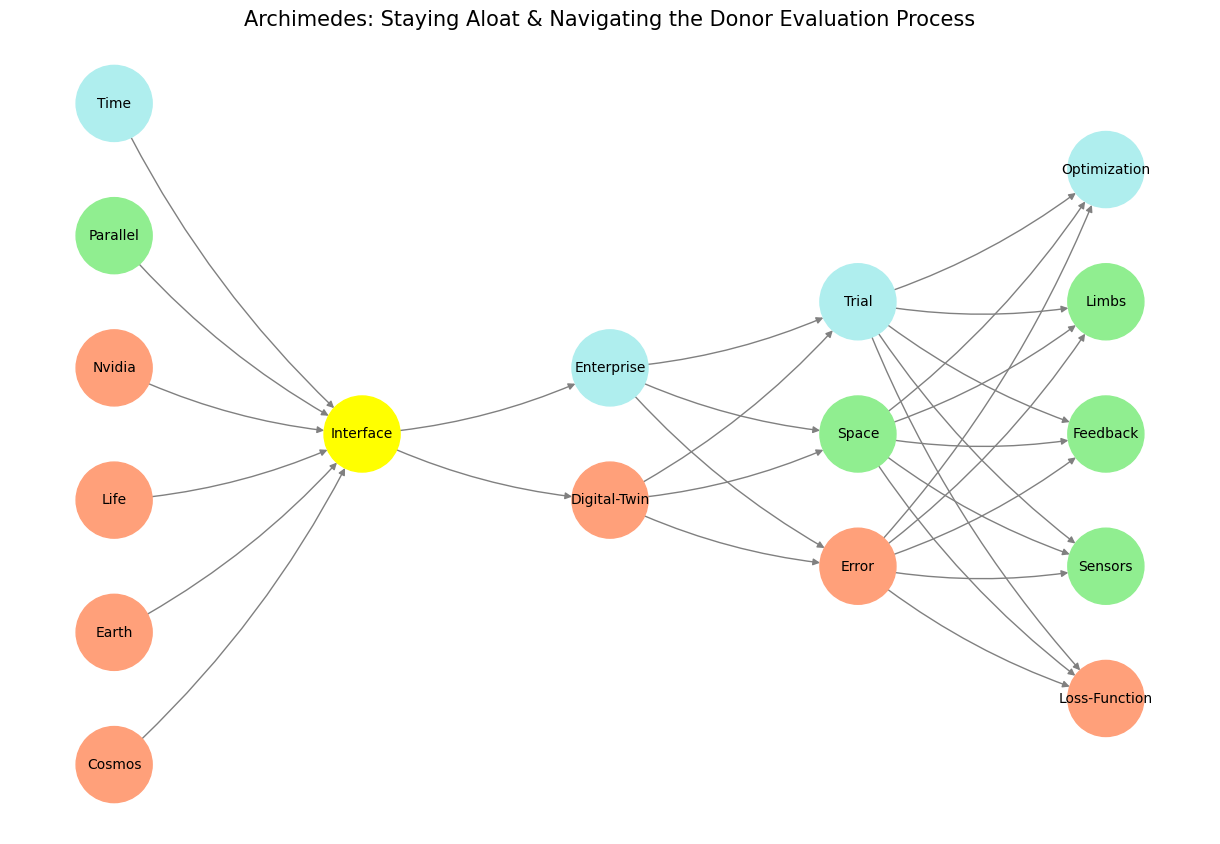

Fig. 4 In our scenario, living kidney donation is the enterprise (OPTN) and the digital twin is the control population (NHANES). When among the perioperative deaths (within 90 days of nephrectomy) we have some listed as homicide, it would be an error to enumerate those as “perioperative risk.” This is the purpose of the digital twin in our agentic (input) layer that should guide a prospective donor. There’s a delicate agency problem here that makes for a good case-study.#