6 Translation#
Sure, I’ll break down the Stata script into smaller code blocks with notes so you can run them separately in a Jupyter Notebook with the Stata kernel.
Block 1: Setup and Logging#
import logging

# Close any existing log files
for handler in logging.root.handlers[:]:
    logging.root.removeHandler(handler)
Block 2: Define Globals#
# Set global variables for the repository URL and local directory path
repo = "https://github.com/muzaale/forum/raw/main/"
dir = "~/documents/melody/pystata"
Block 3: Load Data#
Block 4: Initial Data Exploration#
Show code cell source
import logging
import pandas as pd
import os

# Open a new log file to record the output
logging.basicConfig(filename='jamascript.log', level=logging.INFO, format='%(asctime)s - %(message)s')

# Log the start of the logging process
logging.info('Starting log file')

# Define the local directory and file name
local_dir = os.path.expanduser("~/documents/melody/pystata")
file_name = "esrdRisk_t02tT.csv"
file_path = os.path.join(local_dir, file_name)

# Check if the file exists locally
if os.path.isfile(file_path):
    try:
        data = pd.read_csv(file_path)
        logging.info('Dataset loaded successfully from local file')
    except Exception as e:
        logging.error(f"Failed to load dataset from local file: {e}")
        print(f"Failed to load dataset from local file: {e}")
        data = None
else:
    logging.error(f"File not found: {file_path}")
    print(f"File not found: {file_path}")
    data = None

if data is not None:
    # Display the distribution of the 'donor' variable
    donor_distribution = data['donor'].value_counts()
    print("Distribution of 'donor' variable:")
    print(donor_distribution)

    # Describe the 'rSMGJcEdF_d' variable
    codebook = data['rSMGJcEdF_d'].describe()
    print("\nCodebook for 'rSMGJcEdF_d' variable:")
    print(codebook)

    # Generate a new variable 'entry' based on the 'rSMGJcEdF_t0' variable
    data['entry'] = data['rSMGJcEdF_t0']

    # Logging the creation of the new variable
    logging.info("New variable 'entry' created based on 'rSMGJcEdF_t0'")
else:
    print("Dataset could not be loaded.")
Distribution of 'donor' variable:
donor
Donor                   96217
HealthyNondonor          9364
NotSoHealthyNondonor     8076
Name: count, dtype: int64

Codebook for 'rSMGJcEdF_d' variable:
count       113657
unique           3
top       Censored
freq        108448
Name: rSMGJcEdF_d, dtype: object
/var/folders/z3/nwmg00j178vfczmb9nk9487h0000gn/T/ipykernel_48067/85659033.py:19: DtypeWarning: Columns (1,2,19,23) have mixed types. Specify dtype option on import or set low_memory=False.
  data = pd.read_csv(file_path)
Block 5: Data Cleaning and Adjustment#
This is messing up the dataset
import pandas as pd
import logging

# Assuming 'data' is the DataFrame loaded previously

# Ensure the date columns are in datetime format
data['rSMGJcEdF_tT'] = pd.to_datetime(data['rSMGJcEdF_tT'], format='%d%b%Y', errors='coerce')
data['entry'] = pd.to_datetime(data['entry'], format='%d%b%Y', errors='coerce')

# Define the critical dates
date_2011 = pd.to_datetime('2011-12-31')
date_1994 = pd.to_datetime('1994-01-01')

# Log the start of the adjustment process
logging.info("Starting the adjustment process for linkage dates")

# Linkage for donors after 2011 is untrustworthy
data.loc[(data['rSMGJcEdF_tT'] > date_2011) & (data['donor'] == 1), 'rSMGJcEdF_d'] = 0
data.loc[(data['rSMGJcEdF_tT'] > date_2011) & (data['donor'] == 1), 'rSMGJcEdF_tT'] = date_2011

# Linkage before 1994 is untrustworthy
data.loc[(data['entry'] < date_1994) & (data['rSMGJcEdF_tT'] > date_1994) & (data['donor'] == 1), 'entry'] = date_1994

# Log the completion of the replacement process
logging.info("Linkage for dates after 2011 and before 1994 adjusted successfully")
Block 6: Mortality Analysis Setup#
Show code cell source
import pandas as pd
from lifelines import KaplanMeierFitter
import matplotlib.pyplot as plt
# Assuming 'data' is already the DataFrame loaded previously
# Set the event indicator based on 'Died'
data['event'] = (data['rSMGJcEdF_d'] == 'Died').astype(int)
# Ensure date columns are in datetime format
data['rSMGJcEdF_tT'] = pd.to_datetime(data['rSMGJcEdF_tT'], errors='coerce')
data['rSMGJcEdF_t0'] = pd.to_datetime(data['rSMGJcEdF_t0'], errors='coerce')
data['entry'] = data['rSMGJcEdF_t0'] # Use _t0 as entry
# Calculate the duration from origin to the event or censoring in years
data['duration'] = (data['rSMGJcEdF_tT'] - data['rSMGJcEdF_t0']).dt.total_seconds() / (365.25 * 24 * 60 * 60)
# Calculate the entry duration
data['entry_duration'] = (data['entry'] - data['rSMGJcEdF_t0']).dt.total_seconds() / (365.25 * 24 * 60 * 60)
data['entry_duration'] = data['entry_duration'].fillna(0) # Ensure non-donor entries are set to 0
# Ensure all durations are non-negative and valid
data = data[(data['duration'] >= 0) & (data['entry_duration'] >= 0)]
# Initialize the KaplanMeierFitter
kmf = KaplanMeierFitter()
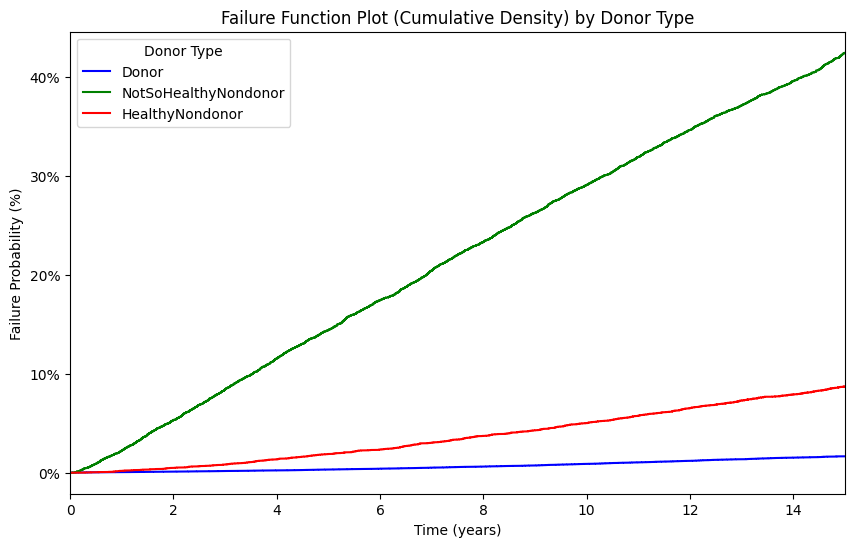
# Plot setup
plt.figure(figsize=(10, 6))
# Unique donor values
donor_values = data['donor'].unique()
# Colors for each donor type
colors = ['blue', 'green', 'red']
# Overlay plots for different donor values
for donor, color in zip(donor_values, colors):
kmf.fit(durations=data[data['donor'] == donor]['duration'],
event_observed=data[data['donor'] == donor]['event'],
entry=data[data['donor'] == donor]['entry_duration'],
label=donor)
ax = kmf.plot_cumulative_density(ci_show=False, color=color)
# Cut off the plot at 15 years
plt.xlim(0, 15)
# Convert y-axis to percentage
vals = ax.get_yticks()
ax.set_yticklabels(['{:,.0%}'.format(x) for x in vals])
# Labels and title
plt.xlabel("Time (years)")
plt.ylabel("Failure Probability (%)")
plt.title("Failure Function Plot (Cumulative Density) by Donor Type")
plt.legend(title="Donor Type")
# Optional: Display the plot (depends on your environment)
plt.show()
/var/folders/z3/nwmg00j178vfczmb9nk9487h0000gn/T/ipykernel_48067/3613857153.py:50: UserWarning: set_ticklabels() should only be used with a fixed number of ticks, i.e. after set_ticks() or using a FixedLocator.
  ax.set_yticklabels(['{:,.0%}'.format(x) for x in vals])
Block 7: Generate Kaplan-Meier Estimates#
Show code cell source
import pandas as pd
from lifelines import KaplanMeierFitter

# Assuming 'data' is already the DataFrame loaded previously

# Set the event indicator based on 'Died'
data['event'] = (data['rSMGJcEdF_d'] == 'Died').astype(int)

# Ensure date columns are in datetime format
data['rSMGJcEdF_tT'] = pd.to_datetime(data['rSMGJcEdF_tT'], errors='coerce')
data['rSMGJcEdF_t0'] = pd.to_datetime(data['rSMGJcEdF_t0'], errors='coerce')
data['entry'] = data['rSMGJcEdF_t0']  # Use _t0 as entry

# Calculate the duration from origin to the event or censoring in years
data['duration'] = (data['rSMGJcEdF_tT'] - data['rSMGJcEdF_t0']).dt.total_seconds() / (365.25 * 24 * 60 * 60)

# Calculate the entry duration
data['entry_duration'] = (data['entry'] - data['rSMGJcEdF_t0']).dt.total_seconds() / (365.25 * 24 * 60 * 60)
data['entry_duration'] = data['entry_duration'].fillna(0)  # Ensure non-donor entries are set to 0

# Ensure all durations are non-negative and valid
data = data[(data['duration'] >= 0) & (data['entry_duration'] >= 0)]

# Initialize the KaplanMeierFitter
kmf = KaplanMeierFitter()

# Time points at which we want to extract survival probabilities
time_points = [5, 12, 15]

# Dictionary to hold the results
results = []

# Fit the model for each donor type and extract the survival probabilities
for donor in data['donor'].unique():
    kmf.fit(durations=data[data['donor'] == donor]['duration'],
            event_observed=data[data['donor'] == donor]['event'],
            entry=data[data['donor'] == donor]['entry_duration'],
            label=donor)

    for time in time_points:
        survival_prob = kmf.survival_function_at_times(time).values[0]
        results.append({
            'donor': donor,
            'time': time,
            'survival_probability': survival_prob,
            'failure_probability': 1 - survival_prob
        })

# Convert results to a DataFrame
results_df = pd.DataFrame(results)

# Save the results to a CSV file
results_df.to_csv('km_results.csv', index=False)

# Display the results
print(results_df)
Show code cell output
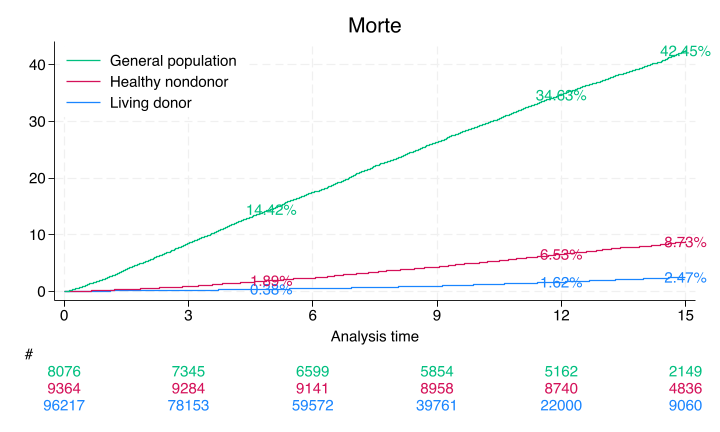
                  donor  time  survival_probability  failure_probability
0                 Donor     5              0.996751             0.003249
1                 Donor    12              0.988017             0.011983
2                 Donor    15              0.983427             0.016573
3  NotSoHealthyNondonor     5              0.855844             0.144156
4  NotSoHealthyNondonor    12              0.653661             0.346339
5  NotSoHealthyNondonor    15              0.575531             0.424469
6       HealthyNondonor     5              0.981093             0.018907
7       HealthyNondonor    12              0.934715             0.065285
8       HealthyNondonor    15              0.912715             0.087285
Only the donor results match Segev, JAMA, 2010 p. 961. The nondonors here are unmatched and so do not yield the same estimates from this paper
A webApp is quick way to approximate these findings using the base-case of the “typical” donor as per Table 1, also on page 961. Namely, 40yo white female with some college education, BMI=28, SBP=120, no hypertension, no history of smoking cigarettes, creatinine 0.9 mg/dL, and eGFR 100 mL/min
Block 8: Summarize Failure Rates#
Block 9: Kaplan-Meier Survival Plot#
Block 11: Save Processed Data#
Block 12: Cox Proportional Hazards Model#
import pandas as pd

# Assuming 'data' is already the DataFrame loaded previously

# Check for constant variables
constant_columns = [col for col in data.columns if data[col].nunique() <= 1]
print("Constant columns:", constant_columns)
Constant columns: ['_st', '_t0', 'entry_duration']
import pandas as pd
from lifelines import CoxPHFitter

# Ensure 'donor' is a categorical variable
data['donor'] = data['donor'].astype('category')

# Select necessary columns
data = data[['duration', 'event', 'donor']]

# Remove constant columns if any
constant_columns = [col for col in data.columns if data[col].nunique() <= 1]
data = data.drop(columns=constant_columns)

print("Constant columns removed:", constant_columns)
Constant columns removed: []
data.head()
| duration | event | donor | |
|---|---|---|---|
| 0 | 13.859001 | 0 | Donor |
| 1 | 9.409993 | 0 | Donor |
| 2 | 8.752909 | 0 | Donor |
| 3 | 8.273785 | 0 | Donor |
| 4 | 14.398357 | 0 | Donor |
import pandas as pd

# Load the data
file_path = '~/documents/melody/local/esrdRisk_t02tT.csv'  # Adjust the file path as needed
data = pd.read_csv(file_path)

# Check the first few rows and the column names
print(data.head())
print(data.columns)
Show code cell output
---------------------------------------------------------------------------
FileNotFoundError                         Traceback (most recent call last)
Cell In[9], line 5
      3 # Load the data
      4 file_path = '~/documents/melody/local/esrdRisk_t02tT.csv'  # Adjust the file path as needed
----> 5 data = pd.read_csv(file_path)
      7 # Check the first few rows and the column names
      8 print(data.head())

File ~/Documents/Melody/myenv/lib/python3.12/site-packages/pandas/io/parsers/readers.py:1026, in read_csv(filepath_or_buffer, sep, delimiter, header, names, index_col, usecols, dtype, engine, converters, true_values, false_values, skipinitialspace, skiprows, skipfooter, nrows, na_values, keep_default_na, na_filter, verbose, skip_blank_lines, parse_dates, infer_datetime_format, keep_date_col, date_parser, date_format, dayfirst, cache_dates, iterator, chunksize, compression, thousands, decimal, lineterminator, quotechar, quoting, doublequote, escapechar, comment, encoding, encoding_errors, dialect, on_bad_lines, delim_whitespace, low_memory, memory_map, float_precision, storage_options, dtype_backend)
   1013 kwds_defaults = _refine_defaults_read(
   1014     dialect,
   1015     delimiter,
   (...)
   1022     dtype_backend=dtype_backend,
   1023 )
   1024 kwds.update(kwds_defaults)
-> 1026 return _read(filepath_or_buffer, kwds)

File ~/Documents/Melody/myenv/lib/python3.12/site-packages/pandas/io/parsers/readers.py:620, in _read(filepath_or_buffer, kwds)
    617 _validate_names(kwds.get("names", None))
    619 # Create the parser.
--> 620 parser = TextFileReader(filepath_or_buffer, **kwds)
    622 if chunksize or iterator:
    623     return parser

File ~/Documents/Melody/myenv/lib/python3.12/site-packages/pandas/io/parsers/readers.py:1620, in TextFileReader.__init__(self, f, engine, **kwds)
   1617     self.options["has_index_names"] = kwds["has_index_names"]
   1619 self.handles: IOHandles | None = None
-> 1620 self._engine = self._make_engine(f, self.engine)

File ~/Documents/Melody/myenv/lib/python3.12/site-packages/pandas/io/parsers/readers.py:1880, in TextFileReader._make_engine(self, f, engine)
   1878     if "b" not in mode:
   1879         mode += "b"
-> 1880 self.handles = get_handle(
   1881     f,
   1882     mode,
   1883     encoding=self.options.get("encoding", None),
   1884     compression=self.options.get("compression", None),
   1885     memory_map=self.options.get("memory_map", False),
   1886     is_text=is_text,
   1887     errors=self.options.get("encoding_errors", "strict"),
   1888     storage_options=self.options.get("storage_options", None),
   1889 )
   1890 assert self.handles is not None
   1891 f = self.handles.handle

File ~/Documents/Melody/myenv/lib/python3.12/site-packages/pandas/io/common.py:873, in get_handle(path_or_buf, mode, encoding, compression, memory_map, is_text, errors, storage_options)
    868 elif isinstance(handle, str):
    869     # Check whether the filename is to be opened in binary mode.
    870     # Binary mode does not support 'encoding' and 'newline'.
    871     if ioargs.encoding and "b" not in ioargs.mode:
    872         # Encoding
--> 873         handle = open(
    874             handle,
    875             ioargs.mode,
    876             encoding=ioargs.encoding,
    877             errors=errors,
    878             newline="",
    879         )
    880     else:
    881         # Binary mode
    882         handle = open(handle, ioargs.mode)

FileNotFoundError: [Errno 2] No such file or directory: '/Users/apollo/documents/melody/local/esrdRisk_t02tT.csv'
Show code cell source
import pandas as pd
from lifelines import CoxPHFitter

# Assuming 'data' is already the DataFrame loaded previously and necessary preprocessing is done

# Ensure 'donor' is a categorical variable
data['donor'] = data['donor'].astype('category')

# Fit a Cox proportional hazards model
cph = CoxPHFitter()
cph.fit(data, duration_col='duration', event_col='event', formula="C(donor)")

# Extract the summary and relevant coefficients
summary = cph.summary

# Filter only relevant columns
coefficients = summary.loc[:, ['coef', 'exp(coef)', 'exp(coef) lower 95%', 'exp(coef) upper 95%']]

# Rename the rows for clarity
coefficients.index = ['HealthyNondonor vs Donor', 'NotSoHealthyNondonor vs Donor']

# Display the simplified results
print("Coefficients and Hazard Ratios Relative to Baseline (Donor):")
print(coefficients)

# Compute hazard ratios
hazard_ratios = coefficients[['exp(coef)', 'exp(coef) lower 95%', 'exp(coef) upper 95%']]
hazard_ratios.columns = ['Hazard Ratio', 'Lower 95% CI', 'Upper 95% CI']

print("\nHazard Ratios Relative to Baseline (Donor):")
print(hazard_ratios)
Show code cell output
Coefficients and Hazard Ratios Relative to Baseline (Donor):
                                   coef  exp(coef)  exp(coef) lower 95%  \
HealthyNondonor vs Donor      -0.286770   0.750684             0.447060
NotSoHealthyNondonor vs Donor  2.359067  10.581077             8.187331

                               exp(coef) upper 95%
HealthyNondonor vs Donor                  1.260518
NotSoHealthyNondonor vs Donor            13.674688

Hazard Ratios Relative to Baseline (Donor):
                               Hazard Ratio  Lower 95% CI  Upper 95% CI
HealthyNondonor vs Donor           0.750684      0.447060      1.260518
NotSoHealthyNondonor vs Donor     10.581077      8.187331     13.674688
Block 13: Save Baseline Survival and Coefficients#
// Define matrix 'b' with model coefficients
matrix define b = e(b)

// Keep baseline survival estimates
keep s0 _t

// Sort and list baseline survival estimates
sort _t s0
list in 1/10

// Save baseline survival estimates
save ${dir}/s0.dta, replace
export delimited using ${dir}/s0.csv, replace

// Save model coefficients
matrix beta = e(b)
svmat beta
keep beta*
drop if missing(beta1)
list
save ${dir}/b.dta, replace
export delimited using ${dir}/b.csv, replace