Cunning Strategy#
Proposal 1: Operationalizing Philosophical Frameworks in Data Science for Real-World Impact#
Abstract#
This chapter reframes the challenges of data access, mentorship conflicts, and interdisciplinary collaboration through a novel philosophical framework integrated with AI and statistical methodologies. It leverages the app’s operationalization of faith, hope, and charity as a means to resolve practical barriers in research while simultaneously advancing personalized medicine, informed consent, and education. By embedding this framework in a case study—90-day perioperative mortality—it lays the groundwork for scalable, equitable, and transparent solutions to systemic challenges in clinical research.
Key Points#
Conflict Resolution through Philosophical Abstraction
Data access conflicts often arise due to competing priorities among mentees and limited resources. This chapter proposes a shift in perspective: instead of viewing data as a finite resource, reframe the problem as one of collaboration and abstraction. By allowing others to be senior authors and focusing instead on the operationalization of philosophical ideas, mentees can redefine their thesis contributions as conceptual breakthroughs rather than resource-dependent outputs.Decoupling Access from Execution
The app demonstrates how researchers without direct IRB-approved access can collaborate effectively. By providing collaborators with pre-coded scripts in Stata, Python, R, or other platforms, researchers can execute analyses on datasets they have access to and return anonymized outputs (e.g., beta coefficients, variance-covariance matrices). These outputs are then integrated into the app’s backend, ensuring compliance with disclosure risks and zero need for direct data handling.Case Study: 90-Day Perioperative Mortality
This philosophical framework can be immediately applied to the case of 90-day perioperative mortality. Using de-identified coefficients and parameter matrices, the app generates risk estimates and standard errors for diverse patient profiles. This approach bypasses the data access bottleneck while advancing the science of individualized risk estimation and informed consent.Scalability for Global Impact
By embedding these methodologies in an open-access platform (e.g., GitHub for scripts, JavaScript for interactive outputs), this model enables researchers worldwide to utilize the app’s capabilities. This framework transforms barriers into opportunities for collaboration, teaching, and dissemination.
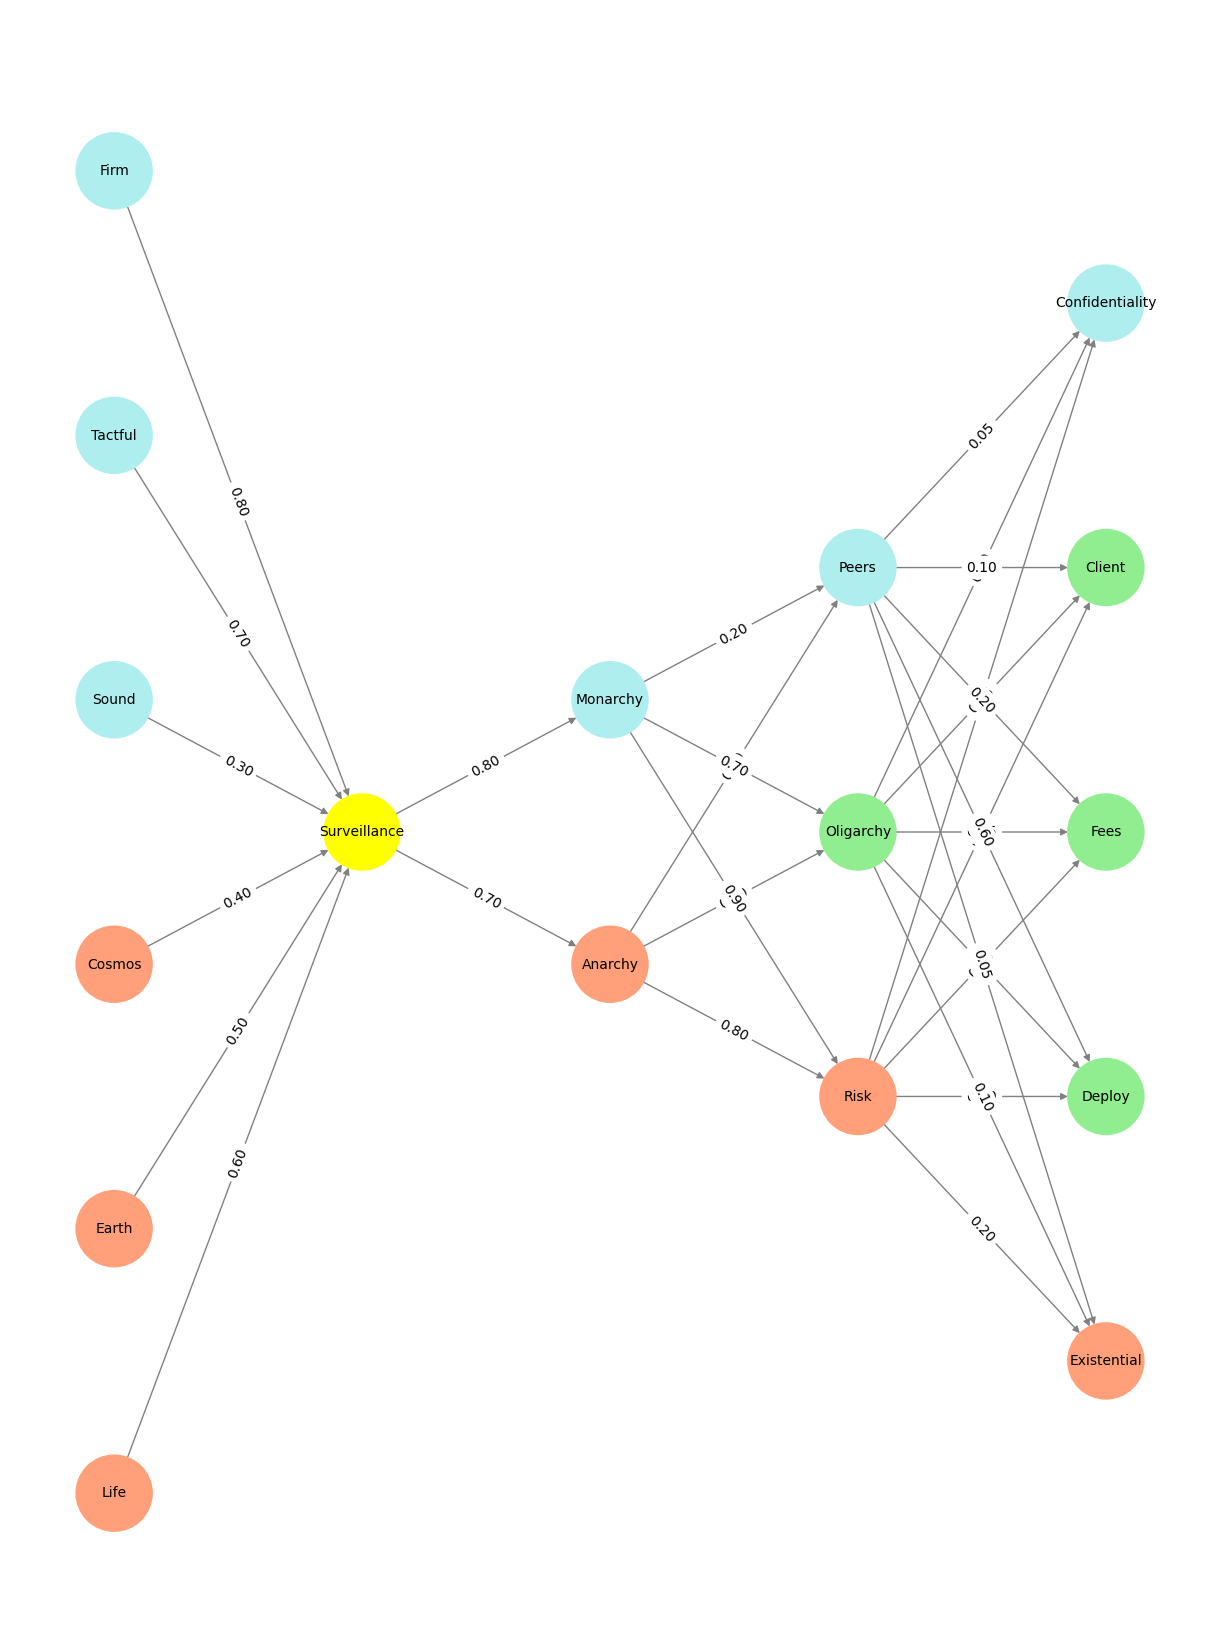
Show code cell source
import numpy as np
import matplotlib.pyplot as plt
import networkx as nx

# Define the neural network structure
def define_layers():
    return {
        'Pre-Input': ['Life','Earth', 'Cosmos', 'Sound', 'Tactful', 'Firm', ],
        'Yellowstone': ['Surveillance'],
        'Input': ['Anarchy', 'Monarchy'],
        'Hidden': [
            'Risk',
            'Oligarchy',
            'Peers',
        ],
        'Output': ['Existential', 'Deploy', 'Fees', 'Client', 'Confidentiality',    ]
    }

# Define weights for the connections
def define_weights():
    return {
        'Pre-Input-Yellowstone': np.array([
            [0.6],
            [0.5],
            [0.4],
            [0.3],
            [0.7],
            [0.8],
            [0.6]
        ]),
        'Yellowstone-Input': np.array([
            [0.7, 0.8]
        ]),
        'Input-Hidden': np.array([[0.8, 0.4, 0.1], [0.9, 0.7, 0.2]]),
        'Hidden-Output': np.array([
            [0.2, 0.8, 0.1, 0.05, 0.2],
            [0.1, 0.9, 0.05, 0.05, 0.1],
            [0.05, 0.6, 0.2, 0.1, 0.05]
        ])
    }

# Assign colors to nodes
def assign_colors(node, layer):
    if node == 'Surveillance':
        return 'yellow'
    if layer == 'Pre-Input' and node in ['Sound', 'Tactful', 'Firm']:
        return 'paleturquoise'
    elif layer == 'Input' and node == 'Monarchy':
        return 'paleturquoise'
    elif layer == 'Hidden':
        if node == 'Peers':
            return 'paleturquoise'
        elif node == 'Oligarchy':
            return 'lightgreen'
        elif node == 'Risk':
            return 'lightsalmon'
    elif layer == 'Output':
        if node == 'Confidentiality':
            return 'paleturquoise'
        elif node in ['Client', 'Fees', 'Deploy']:
            return 'lightgreen'
        elif node == 'Existential':
            return 'lightsalmon'
    return 'lightsalmon'  # Default color

# Calculate positions for nodes
def calculate_positions(layer, center_x, offset):
    layer_size = len(layer)
    start_y = -(layer_size - 1) / 2  # Center the layer vertically
    return [(center_x + offset, start_y + i) for i in range(layer_size)]

# Create and visualize the neural network graph
def visualize_nn():
    layers = define_layers()
    weights = define_weights()
    G = nx.DiGraph()
    pos = {}
    node_colors = []
    center_x = 0  # Align nodes horizontally

    # Add nodes and assign positions
    for i, (layer_name, nodes) in enumerate(layers.items()):
        y_positions = calculate_positions(nodes, center_x, offset=-len(layers) + i + 1)
        for node, position in zip(nodes, y_positions):
            G.add_node(node, layer=layer_name)
            pos[node] = position
            node_colors.append(assign_colors(node, layer_name))

    # Add edges and weights
    for layer_pair, weight_matrix in zip(
        [('Pre-Input', 'Yellowstone'), ('Yellowstone', 'Input'), ('Input', 'Hidden'), ('Hidden', 'Output')],
        [weights['Pre-Input-Yellowstone'], weights['Yellowstone-Input'], weights['Input-Hidden'], weights['Hidden-Output']]
    ):
        source_layer, target_layer = layer_pair
        for i, source in enumerate(layers[source_layer]):
            for j, target in enumerate(layers[target_layer]):
                weight = weight_matrix[i, j]
                G.add_edge(source, target, weight=weight)

    # Customize edge thickness for specific relationships
    edge_widths = []
    for u, v in G.edges():
        if u in layers['Hidden'] and v == 'Kapital':
            edge_widths.append(6)  # Highlight key edges
        else:
            edge_widths.append(1)

    # Draw the graph
    plt.figure(figsize=(12, 16))
    nx.draw(
        G, pos, with_labels=True, node_color=node_colors, edge_color='gray',
        node_size=3000, font_size=10, width=edge_widths
    )
    edge_labels = nx.get_edge_attributes(G, 'weight')
    nx.draw_networkx_edge_labels(G, pos, edge_labels={k: f'{v:.2f}' for k, v in edge_labels.items()})
    plt.title(" ")

    # Save the figure to a file
    # plt.savefig("figures/logo.png", format="png")

    plt.show()

# Run the visualization
visualize_nn()


