
Anchor ⚓️#
The landscape of clinical research is at a pivotal juncture. The traditional silos of academic medicine, big pharma, and regulatory oversight are becoming increasingly archaic in an age defined by transparency, scalability, and open collaboration. As I develop an app designed to revolutionize how we evaluate risk in live kidney donation, it is clear to me that the same principles powering version control systems like GitHub and decentralized ecosystems like blockchain can be harnessed to disrupt clinical research. What if clinical research became an open canvas, a transparent marketplace where innovation, data, and hypotheses flowed freely, incentivized not by academic prestige but by tangible tokens of value?
At its core, the app I’ve built appears simple: it personalizes risk assessment for live kidney donors by integrating Kaplan-Meier curves, multivariable regressions, and digital twins. But its back end reveals the full machinery of clinical research, from the raw inputs of electronic patient records (EPRs) to the variance-covariance matrices underlying predictive models. This transparency offers a unique educational opportunity. Students, researchers, and even laypeople can reverse-engineer the app, exploring how data is processed, hypotheses are generated, and findings are disseminated. The beauty of GitHub, which I’ve recently embraced, lies in its ability to document every iteration, fork, and pull request, ensuring that contributions are both transparent and iterative. Translating this ethos to clinical research could democratize discovery, making it accessible to anyone with curiosity and a script.

Fig. 4 Strategic Ambiguity. The Red Queen presents rather fascinating scenarios to us.#
The potential for tokenization in this ecosystem is immense. Blockchain, which underpins Bitcoin’s value, operates on principles of decentralization, trustlessness, and immutability. These same principles could apply to clinical research, where tokens act as currency for mining scientific insights. Imagine a system where individuals or teams are rewarded with tokens for identifying research questions, aligning hypotheses with global or personal priorities, or running regression scripts on IRB-approved datasets. These tokens could be exchanged for financial rewards, professional recognition, or access to premium datasets, creating a thriving marketplace for innovation. Such a system would incentivize not just the generation of hypotheses but their alignment with real-world impact, bridging the gap between academia and industry.
Clinical research has traditionally been divided into two spheres: observational studies, largely the domain of academia, and clinical trials, dominated by big pharma. Both rely on similar infrastructures—data, hypotheses, and statistical models—but their scales and incentives differ drastically. Observational studies are underfunded and undervalued, yet they provide the foundation for understanding real-world health outcomes. By tokenizing this process, we can level the playing field. A decentralized system would allow researchers to mine observational data for valuable insights, bypassing the bottlenecks of grant proposals and regulatory hurdles. Tokens could incentivize not just the discovery of patterns but the development of scripts and models that others can use, creating a virtuous cycle of open science.
This vision aligns with the larger trends of the digital age. Projects like Stargate, with its massive investments in data centers and EPRs, signal a future where data is abundant but underutilized. The infrastructure I propose complements this by ensuring that data is not only accessible but actionable. Researchers could submit scripts to mine datasets, earning tokens based on the utility of their outputs. Tokens could also incentivize interdisciplinary collaborations, bringing in experts from fields like machine learning, economics, and sociology to address questions that traditional clinical research struggles to answer.
Such a system would also disrupt the entrenched hierarchies of academia. In this “wild, wild west” of open science, the barriers to entry would be drastically lowered. No longer would aspiring researchers need to endure the torturous gauntlet of traditional epidemiology or statistical training. Instead, they could learn by doing, leveraging pre-built scripts and transparent workflows to contribute meaningfully to the field. The infrastructure would serve as a training ground, fostering a new generation of scientists who understand not just the theory but the practice of clinical research.
Tokenization would extend beyond academia. Patients, often relegated to passive roles in the research process, could actively participate by contributing their data, aligning it with research priorities, and earning tokens in return. This could foster a sense of ownership and engagement, transforming the patient-researcher dynamic. Furthermore, by integrating real-world variables like income, demographics, and lifestyle, the system could transcend the limitations of mouse models, offering insights that are both biologically precise and socially relevant.
The app I’ve developed is a prototype of this vision, but its scalability is evident. Initially designed for live kidney donation, its framework—risk personalization, digital twins, and robust statistical modeling—can be adapted to any clinical or observational setting. The back end, with its focus on variance and covariance matrices, captures the complexity of human health, while the front end simplifies this complexity into actionable insights. This duality—simple on the surface, intricate underneath—makes it a perfect entry point for students, researchers, and developers to engage with clinical research in unprecedented ways.
GitHub and version control systems provide the technical foundation for this vision. They allow for iterative improvement, transparent documentation, and decentralized collaboration. Blockchain adds a layer of trust and incentivization, ensuring that contributions are recognized and rewarded. Together, these technologies could transform clinical research into an open, dynamic ecosystem where anyone—from nerds to clinicians—can contribute, innovate, and benefit.
In the end, this is about reimagining what clinical research can be. It’s about creating a marketplace where value is determined not by academic prestige or corporate interests but by the impact of insights on human health. It’s about empowering individuals to mine the vast reserves of data that modern medicine generates, aligning them with the questions that matter most. And it’s about ensuring that the system is open, transparent, and equitable, paving the way for a future where the boundaries between academia, industry, and the public dissolve in favor of a shared pursuit of knowledge and well-being.
Show code cell source
import numpy as np
import matplotlib.pyplot as plt
import networkx as nx

# Define the neural network fractal
def define_layers():
    return {
        'World': ['Cosmos', 'Planet', 'Life', 'Ecosystem', 'Generative', 'Cartel', ], ## Cosmos, Planet
        'Perception': ['Perception'], # Life
        'Agency': ['Hustle', 'Narrative'], # Ecosystem (Beyond Principal-Agent-Other)
        'Generative': ['Ratio', 'Competition', 'Odds'], # Generative
        'Physical': ['Volatile', 'Unknown',  'Horse', 'Known', 'Stable'] # Physical
    }

# Assign colors to nodes
def assign_colors():
    color_map = {
        'yellow': ['Perception'],
        'paleturquoise': ['Cartel', 'Narrative', 'Odds', 'Stable'],
        'lightgreen': ['Generative', 'Competition', 'Known', 'Horse', 'Unknown'],
        'lightsalmon': [
            'Life', 'Ecosystem', 'Hustle', # Ecosystem = Red Queen = Prometheus = Sacrifice
            'Ratio', 'Volatile'
        ],
    }
    return {node: color for color, nodes in color_map.items() for node in nodes}

# Calculate positions for nodes
def calculate_positions(layer, x_offset):
    y_positions = np.linspace(-len(layer) / 2, len(layer) / 2, len(layer))
    return [(x_offset, y) for y in y_positions]

# Create and visualize the neural network graph
def visualize_nn():
    layers = define_layers()
    colors = assign_colors()
    G = nx.DiGraph()
    pos = {}
    node_colors = []

    # Add nodes and assign positions
    for i, (layer_name, nodes) in enumerate(layers.items()):
        positions = calculate_positions(nodes, x_offset=i * 2)
        for node, position in zip(nodes, positions):
            G.add_node(node, layer=layer_name)
            pos[node] = position
            node_colors.append(colors.get(node, 'lightgray'))  # Default color fallback

    # Add edges (automated for consecutive layers)
    layer_names = list(layers.keys())
    for i in range(len(layer_names) - 1):
        source_layer, target_layer = layer_names[i], layer_names[i + 1]
        for source in layers[source_layer]:
            for target in layers[target_layer]:
                G.add_edge(source, target)

    # Draw the graph
    plt.figure(figsize=(12, 8))
    nx.draw(
        G, pos, with_labels=True, node_color=node_colors, edge_color='gray',
        node_size=3000, font_size=9, connectionstyle="arc3,rad=0.2"
    )
    plt.title("Bit Coin as Perception, Transactions as Ecosystem, Governments & Banks as Cartel", fontsize=15)
    plt.show()

# Run the visualization
visualize_nn()
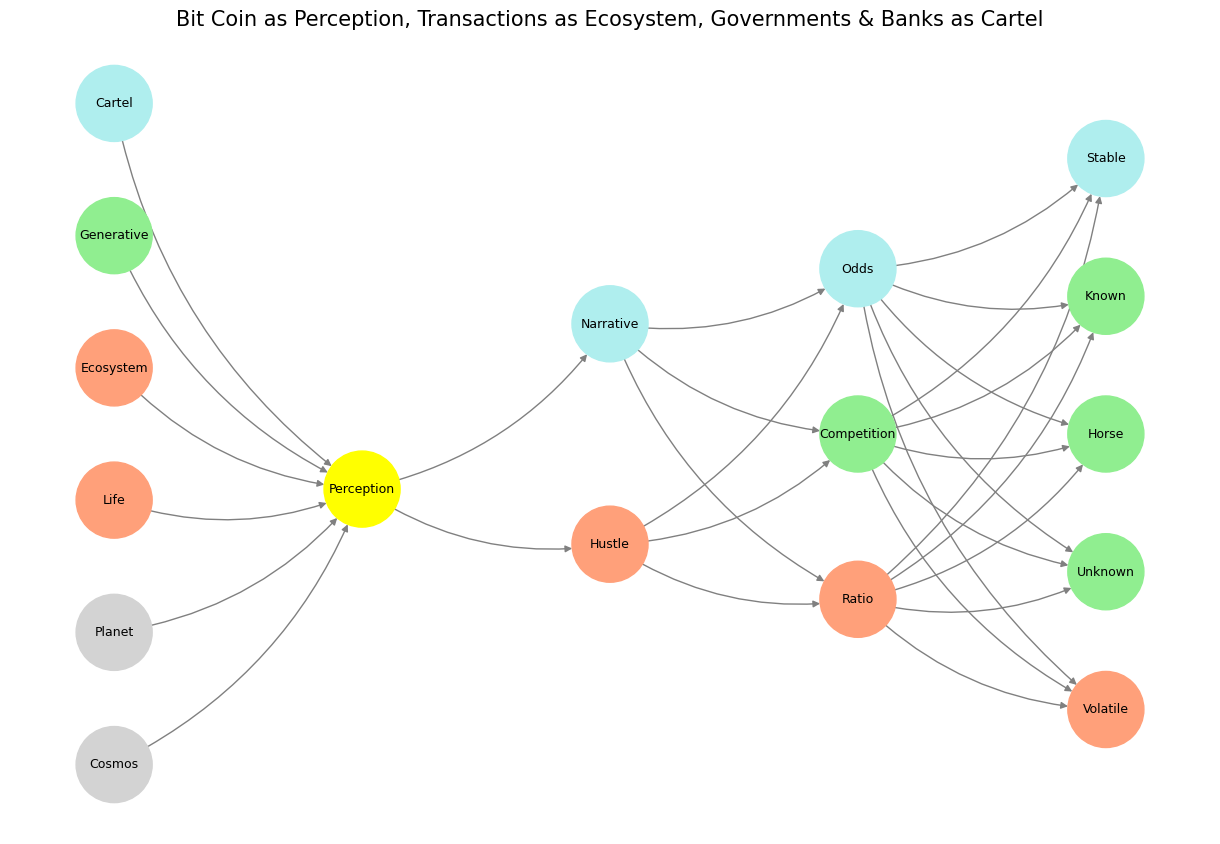

Fig. 5 How now, how now? What say the citizens? Now, by the holy mother of our Lord, The citizens are mum, say not a word.#