
Cunning Strategy#
This perspective captures the crux of the tension modernity faces: how to reconcile the singularity of a shared “node”—perspectivism—while acknowledging its inherent multiplicity. The yellow node, symbolically “single,” encapsulates the paradox of our age: it demands optimization of perception itself, yet defies resolution into a singular consensus because its essence is plurality. Each perspective holds equal weight, and therein lies both its power and its challenge.
In a way, the optimization of this node is a radical shift. Historically, optimizations have centered on collective agreements—truths, systems, hierarchies—but perspectivism rejects the flattening of individual vantage points into one universal truth. Instead, it suggests an ongoing negotiation, a dynamic process where perspectives coexist without convergence.
Modernity’s struggle with “my truth, your truth, their truth” reflects the discomfort of existing in a system that prizes individual agency but lacks a unifying framework. The question becomes: can the yellow node—the cornerstone of perception and subjectivity—be optimized in a way that respects its diversity without descending into chaos? Perhaps the optimization lies not in agreement but in creating a framework where the multiplicity of perspectives enhances rather than undermines the collective.
This is not about solving the paradox but embracing it as the defining feature of our era. In the RICHER framework, the yellow node is both a cornerstone and a bottleneck—a point where all paths converge but no single path dominates. It symbolizes the struggle and beauty of living in a world where everyone’s view matters, even when that inclusivity resists coherence. Modernity’s challenge is not to resolve this but to live within its tension, finding meaning and stability in its inherent contradictions.
Show code cell source
import numpy as np
import matplotlib.pyplot as plt
import networkx as nx

# Define the neural network structure
def define_layers():
    return {
        'World': ['Cosmos', 'Earth', 'Life', 'Cost', 'Parallel', 'Time'], # Divine: Cosmos-Earth; Red Queen: Life-Cost; Machine: Parallel-Time
        'Perception': ['Perspectivism'],
        'Agency': ['Surprise', 'Optimism'],
        'Generativity': ['Anarchy', 'Oligarchy', 'Monarchy'],
        'Physicality': ['Dynamic', 'Partisan', 'Common Wealth', 'Non-Partisan', 'Static']
    }

# Assign colors to nodes
def assign_colors(node, layer):
    if node == 'Perspectivism':
        return 'yellow'
    if layer == 'World' and node in [ 'Time']:
        return 'paleturquoise'
    if layer == 'World' and node in [ 'Parallel']:
        return 'lightgreen'
    if layer == 'World' and node in [ 'Cosmos', 'Earth']:
        return 'lightgray'
    elif layer == 'Agency' and node == 'Optimism':
        return 'paleturquoise'
    elif layer == 'Generativity':
        if node == 'Monarchy':
            return 'paleturquoise'
        elif node == 'Oligarchy':
            return 'lightgreen'
        elif node == 'Anarchy':
            return 'lightsalmon'
    elif layer == 'Physicality':
        if node == 'Static':
            return 'paleturquoise'
        elif node in ['Non-Partisan', 'Common Wealth', 'Partisan']:
            return 'lightgreen'
        elif node == 'Dynamic':
            return 'lightsalmon'
    return 'lightsalmon'  # Default color

# Calculate positions for nodes
def calculate_positions(layer, center_x, offset):
    layer_size = len(layer)
    start_y = -(layer_size - 1) / 2  # Center the layer vertically
    return [(center_x + offset, start_y + i) for i in range(layer_size)]

# Create and visualize the neural network graph
def visualize_nn():
    layers = define_layers()
    G = nx.DiGraph()
    pos = {}
    node_colors = []
    center_x = 0  # Align nodes horizontally

    # Add nodes and assign positions
    for i, (layer_name, nodes) in enumerate(layers.items()):
        y_positions = calculate_positions(nodes, center_x, offset=-len(layers) + i + 1)
        for node, position in zip(nodes, y_positions):
            G.add_node(node, layer=layer_name)
            pos[node] = position
            node_colors.append(assign_colors(node, layer_name))

    # Add edges (without weights)
    for layer_pair in [
        ('World', 'Perception'), ('Perception', 'Agency'), ('Agency', 'Generativity'), ('Generativity', 'Physicality')
    ]:
        source_layer, target_layer = layer_pair
        for source in layers[source_layer]:
            for target in layers[target_layer]:
                G.add_edge(source, target)

    # Draw the graph
    plt.figure(figsize=(12, 8))
    nx.draw(
        G, pos, with_labels=True, node_color=node_colors, edge_color='gray',
        node_size=3000, font_size=10, connectionstyle="arc3,rad=0.1"
    )
    plt.title("Snails Pace vs. Compressed Time", fontsize=15)
    plt.show()

# Run the visualization
visualize_nn()
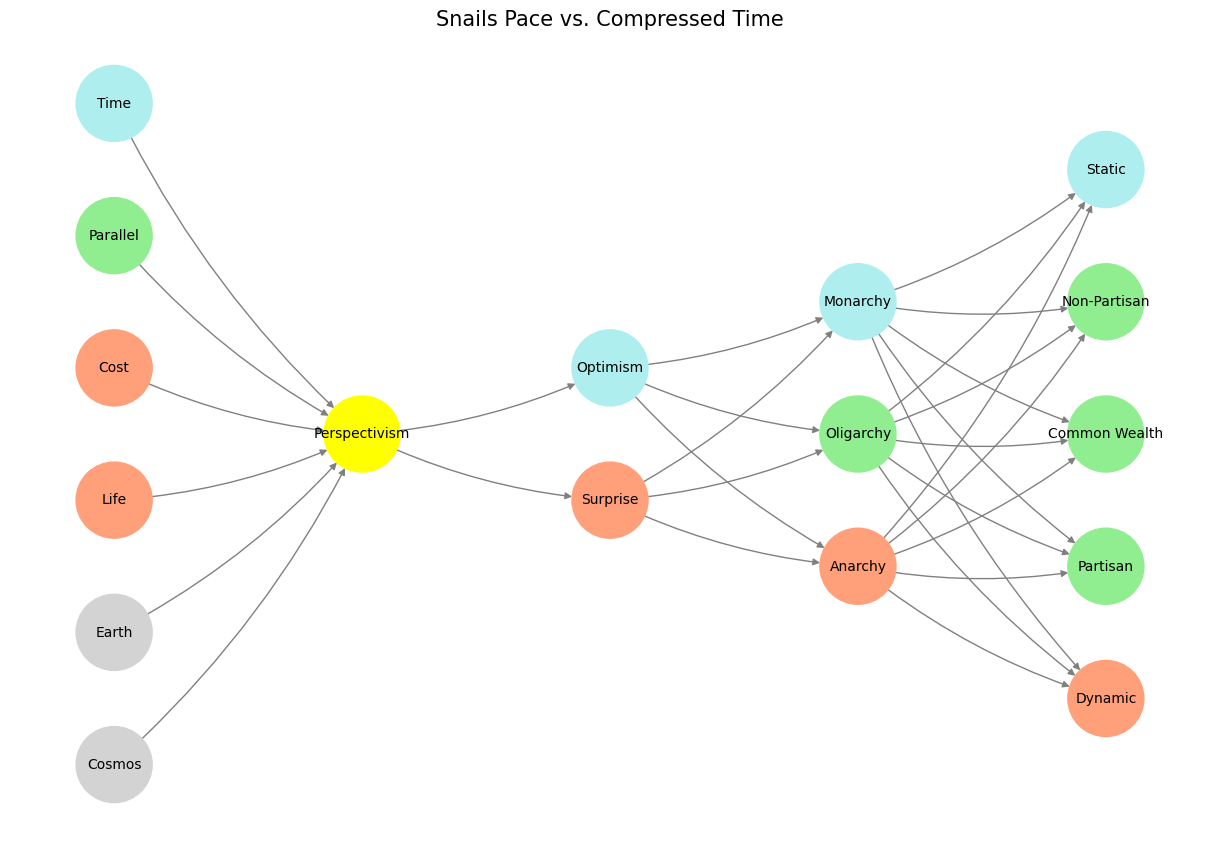

Fig. 8 Nostalgia & Romanticism. When monumental ends (victory), antiquarian means (war), and critical justification (bloodshed) were all compressed into one figure-head: hero#