
Gamified Exchanges, Xβ#
ATP, Acetylecholine, Adenosine for a fractal, the iterative node, as well as the entire hidden layer including adversarial, iterative, and cooperative nodes
Show code cell source
import numpy as np
import matplotlib.pyplot as plt
import networkx as nx
# Define the neural network fractal
def define_layers():
return {
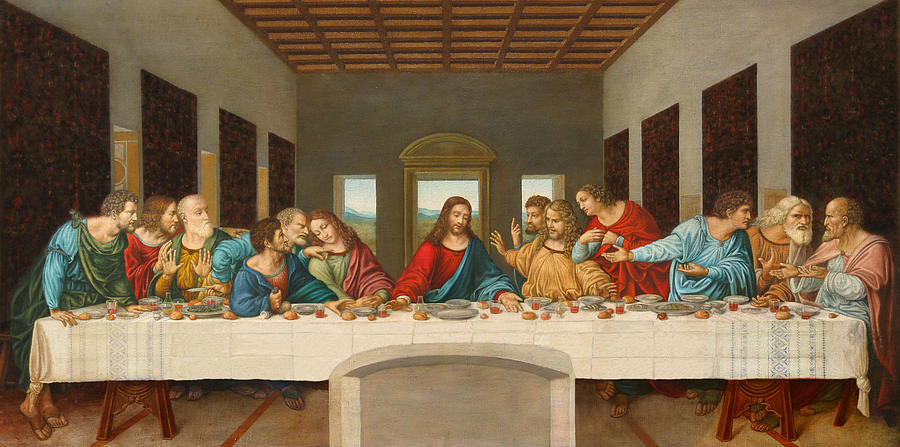
'World': ['Cosmos-Entropy', 'Planet-Tempered', 'Life-Needs', 'Ecosystem-Costs', 'Generative-Means', 'Cartel-Ends', ], ## Cosmos, Planet
'Perception': ['Perception-Ledger'], # Life
'Agency': ['Open-Nomiddleman', 'Closed-Trusted'], # Ecosystem (Beyond Principal-Agent-Other)
'Generative': ['Ratio-Weaponized', 'Competition-Tokenized', 'Odds-Monopolized'], # Generative
'Physical': ['Volatile-Distributed', 'Unknown-Players', 'Freedom-Crypto', 'Known-Transactions', 'Stable-Central'] # Physical
}
# Assign colors to nodes
def assign_colors():
color_map = {
'yellow': ['Perception-Ledger'],
'paleturquoise': ['Cartel-Ends', 'Closed-Trusted', 'Odds-Monopolized', 'Stable-Central'],
'lightgreen': ['Generative-Means', 'Competition-Tokenized', 'Known-Transactions', 'Freedom-Crypto', 'Unknown-Players'],
'lightsalmon': [
'Life-Needs', 'Ecosystem-Costs', 'Open-Nomiddleman', # Ecosystem = Red Queen = Prometheus = Sacrifice
'Ratio-Weaponized', 'Volatile-Distributed'
],
}
return {node: color for color, nodes in color_map.items() for node in nodes}
# Calculate positions for nodes
def calculate_positions(layer, x_offset):
y_positions = np.linspace(-len(layer) / 2, len(layer) / 2, len(layer))
return [(x_offset, y) for y in y_positions]
# Create and visualize the neural network graph
def visualize_nn():
layers = define_layers()
colors = assign_colors()
G = nx.DiGraph()
pos = {}
node_colors = []
# Add nodes and assign positions
for i, (layer_name, nodes) in enumerate(layers.items()):
positions = calculate_positions(nodes, x_offset=i * 2)
for node, position in zip(nodes, positions):
G.add_node(node, layer=layer_name)
pos[node] = position
node_colors.append(colors.get(node, 'lightgray')) # Default color fallback
# Add edges (automated for consecutive layers)
layer_names = list(layers.keys())
for i in range(len(layer_names) - 1):
source_layer, target_layer = layer_names[i], layer_names[i + 1]
for source in layers[source_layer]:
for target in layers[target_layer]:
G.add_edge(source, target)
# Draw the graph
plt.figure(figsize=(12, 8))
nx.draw(
G, pos, with_labels=True, node_color=node_colors, edge_color='gray',
node_size=3000, font_size=9, connectionstyle="arc3,rad=0.2"
)
plt.title("Old vs. New", fontsize=15)
plt.show()
# Run the visualization
visualize_nn()
Show code cell source
import matplotlib.pyplot as plt
import numpy as np
def draw_triangle(ax, vertices, labels, color='black'):
"""Draws a triangle given vertices and labels for each vertex with matching color."""
triangle = plt.Polygon(vertices, edgecolor=color, fill=None, linewidth=1.5)
ax.add_patch(triangle)
for i, (x, y) in enumerate(vertices):
ax.text(x, y, labels[i], fontsize=12, ha='center', va='center', color=color) # Set label color
def get_triangle_vertices_3d(center, radius, perspective_scale, tilt):
"""
Returns the vertices of a tilted equilateral triangle for a 3D effect.
`perspective_scale` shrinks the triangle to simulate depth.
`tilt` applies a slight rotation for perspective effect.
"""
angles = np.linspace(0, 2 * np.pi, 4)[:-1] + np.pi/2 # angles for vertices of an equilateral triangle
vertices = np.column_stack([center[0] + radius * perspective_scale * np.cos(angles + tilt),
center[1] + radius * perspective_scale * np.sin(angles + tilt)])
return vertices
# Create the plot
fig, ax = plt.subplots(figsize=(12,22)) # Adjust the width and height as needed
ax.set_aspect('equal')
# Define the centers for each triangle, shifting each down from the previous
centers = [(0, 10), (2, 6), (4, 4)] # Blue at the top, green in the middle, red at the bottom
radii = [6, 4.5, 3] # Adjusting radii for each layer
triads = [
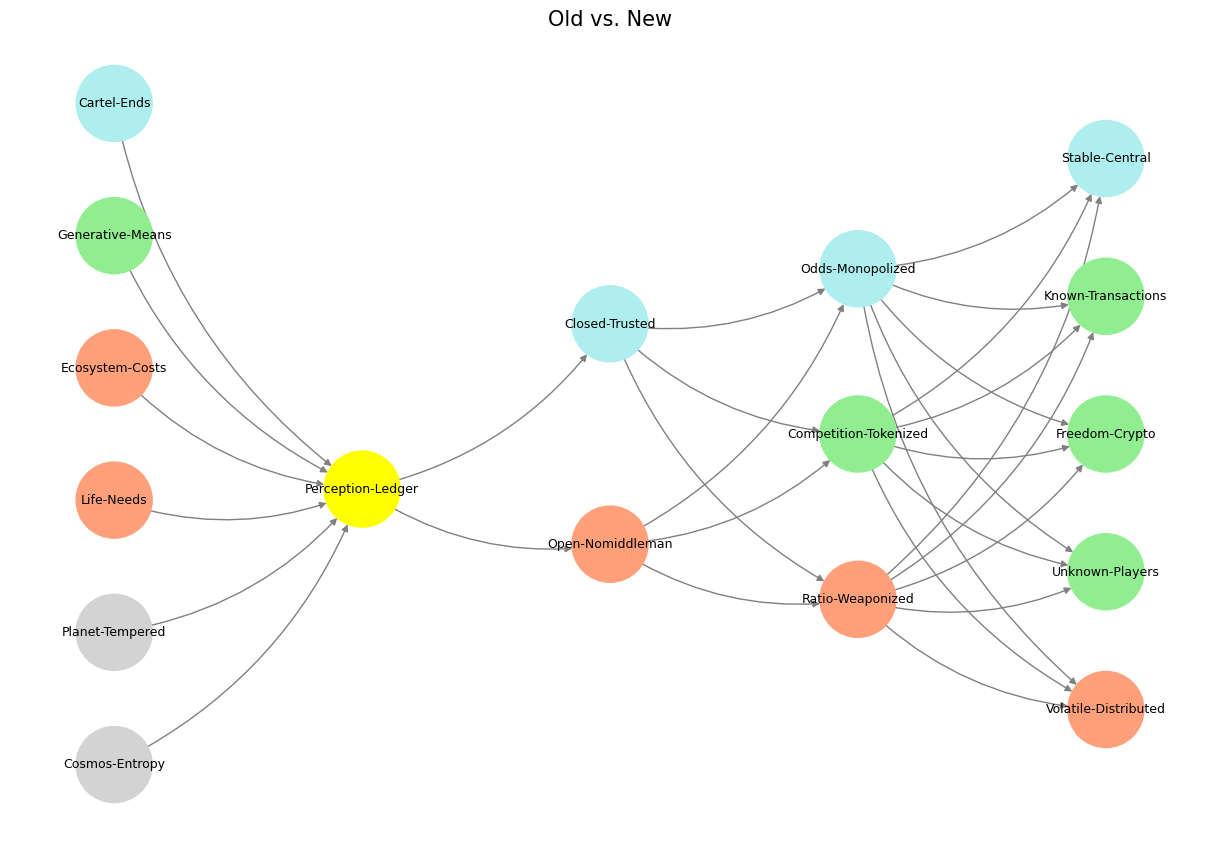
['Faith', 'Love', 'Hope'], # Blue topmost triangle
['Loyalty', 'Transactional', 'Recalibration'], # Green middle triangle
['Betrayal', 'Power', 'Survival'] # Red bottom triangle
]
# Set the color scheme: blue, green, red
colors = ['paleturquoise', 'lightgreen', 'lightsalmon']
# 3D perspective parameters: smaller scale as the fractal moves inward (simulating depth)
scales = [1.4, 0.9, 0.7] # simulate depth
tilts = [0, np.pi / 12, np.pi / 6] # slight rotation for perspective
# Draw the triangles with increasing radius and perspective scaling
for center, radius, triad, color, scale, tilt in zip(centers, radii, triads, colors, scales, tilts):
vertices = get_triangle_vertices_3d(center, radius, scale, tilt)
draw_triangle(ax, vertices, triad, color=color)
# Set limits and hide axes to fit the frame
ax.set_xlim(-10, 10)
ax.set_ylim(1, 20)
ax.axis('off')
# Save the plot as 'logo.png'
# plt.savefig('figures/logo.png', dpi=300, bbox_inches='tight')
# Adjust layout to remove extra white space
plt.subplots_adjust(left=0, right=1, top=1, bottom=0)
# Display the plot
plt.show()
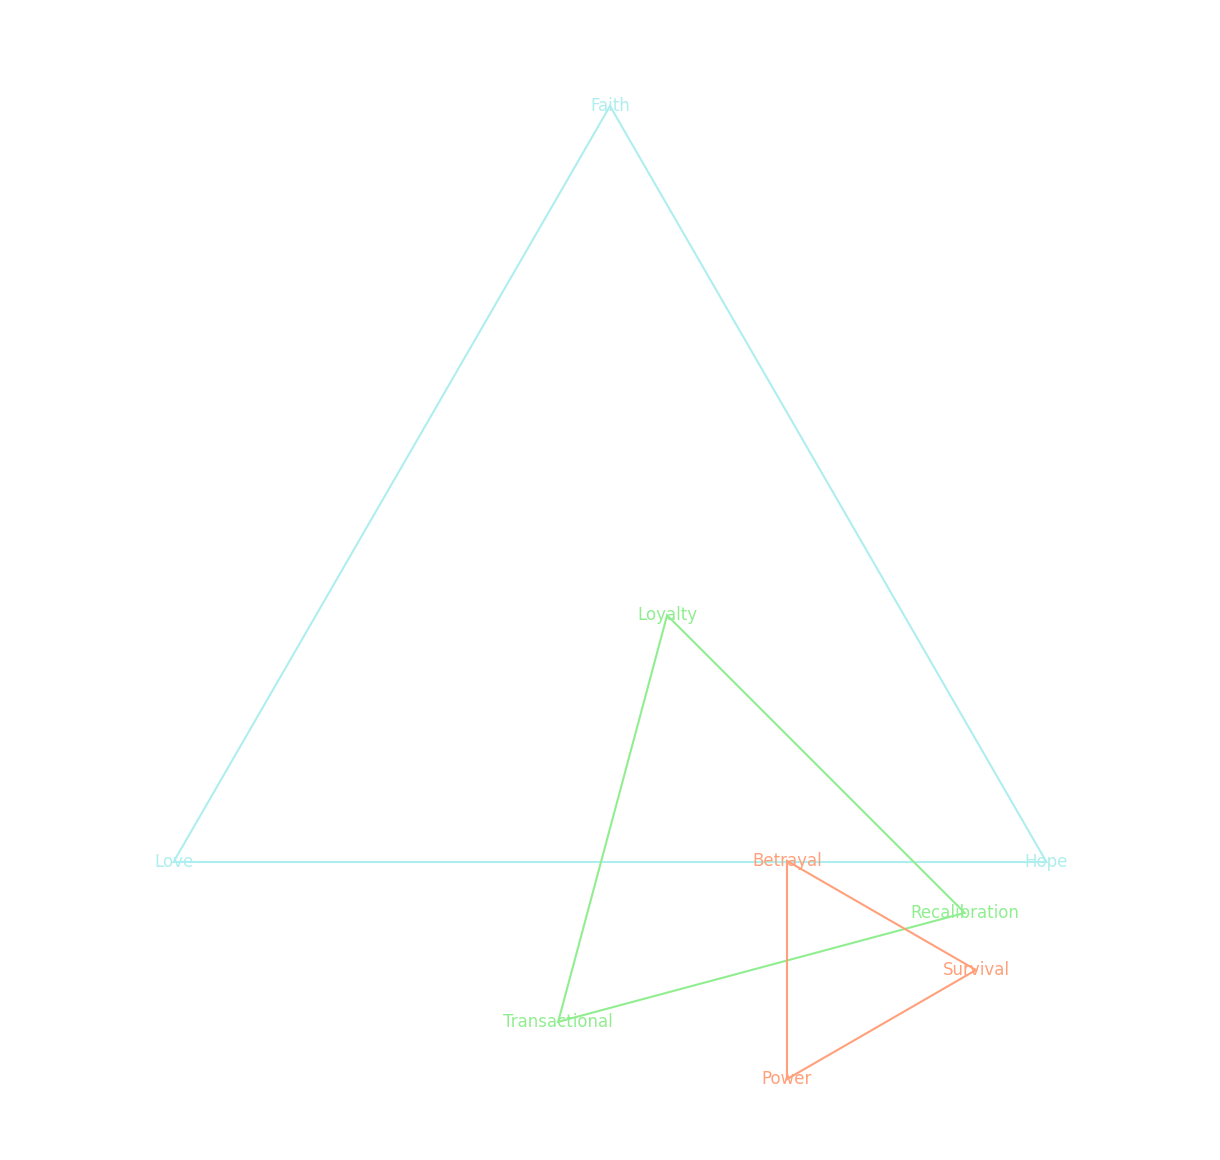

Fig. 17 Roman Strategy & Judas Betrayal: Tact, Firmness, Soundness. DNA (biology) encodes a sophisticated system for risk assessment, dynamically responding to climate, locality, diet, and recreational activity, while language (sociology) accelerates iteration by providing rapid adaptive feedback. Language, in turn, can trigger DNA-driven pathways, bridging sociological interaction with biological underpinnings. The interplay of molecular equilibria mirrors the three forces fundamental to music: rhythm, chords, and melody. Cooperative/Rhythm is governed by molecules such as oxytocin, endorphins, and serotonin, which foster emotional bonding, cyclical harmony, and trust. Oxytocin, for example, mimicked by MDMA (“ecstasy”), enhances social bonding and euphoria by stimulating serotonin pathways. Iterative/Chords depend on GABA, adenosine, and melatonin, which regulate balance, rest, and diurnal recalibration, maintaining homeostasis through cyclical processes. Adversarial/Conflict engages glutamate, adrenaline, and cortisol, molecules that incite tension and drive transformative action. Noradrenaline heightens focus during adversarial challenges, dopamine incentivizes tokenization through reward mechanisms, and serotonin, bridging all three forces, stabilizes embodiment by integrating rhythm with meaning. This biochemical choreography underscores the fractal complexity of human systems, aligning biology, sociology, and music as interconnected pathways of adaptation.
1 2 3#