Fall (Backpropagation)#
Show code cell source
import matplotlib.pyplot as plt
import numpy as np

def draw_triangle(ax, vertices, labels, color='black'):
    """Draws a triangle given vertices and labels for each vertex with matching color."""
    triangle = plt.Polygon(vertices, edgecolor=color, fill=None, linewidth=1.5)
    ax.add_patch(triangle)
    for i, (x, y) in enumerate(vertices):
        ax.text(x, y, labels[i], fontsize=12, ha='center', va='center', color=color)  # Set label color

def get_triangle_vertices_3d(center, radius, perspective_scale, tilt):
    """
    Returns the vertices of a tilted equilateral triangle for a 3D effect.
    `perspective_scale` shrinks the triangle to simulate depth.
    `tilt` applies a slight rotation for perspective effect.
    """
    angles = np.linspace(0, 2 * np.pi, 4)[:-1] + np.pi/2  # angles for vertices of an equilateral triangle
    vertices = np.column_stack([center[0] + radius * perspective_scale * np.cos(angles + tilt),
                                center[1] + radius * perspective_scale * np.sin(angles + tilt)])
    return vertices

# Create the plot
fig, ax = plt.subplots(figsize=(12, 12))  # Adjust the width and height as needed

ax.set_aspect('equal')

# Define the centers for each triangle, shifting each down from the previous
centers = [(0, 10), (0, 0), (0, -10)]  # Blue at the top, green in the middle, red at the bottom
radii = [6, 4.5, 3]  # Adjusting radii for each layer
triads = [
    ['Faith', 'Love', 'Hope'],          # Blue topmost triangle
    ['Loyalty', 'Transactional', 'Recalibration'],  # Green middle triangle
    ['Betrayal', 'Power', 'Survival']    # Red bottom triangle
]

# Set the color scheme: blue, green, red
colors = ['paleturquoise', 'lightgreen', 'lightsalmon']

# 3D perspective parameters: smaller scale as the fractal moves inward (simulating depth)
scales = [1.4, 0.9, 0.7]  # simulate depth
tilts = [0, np.pi / 12, np.pi / 6]  # slight rotation for perspective

# Draw the triangles with increasing radius and perspective scaling
for center, radius, triad, color, scale, tilt in zip(centers, radii, triads, colors, scales, tilts):
    vertices = get_triangle_vertices_3d(center, radius, scale, tilt)
    draw_triangle(ax, vertices, triad, color=color)

# Set limits and hide axes to fit the frame
ax.set_xlim(-10, 10)
ax.set_ylim(-20, 20)
ax.axis('off')

# Save the plot as 'logo.png'
# plt.savefig('figures/logo.png', dpi=300, bbox_inches='tight')

# Display the plot
plt.show()


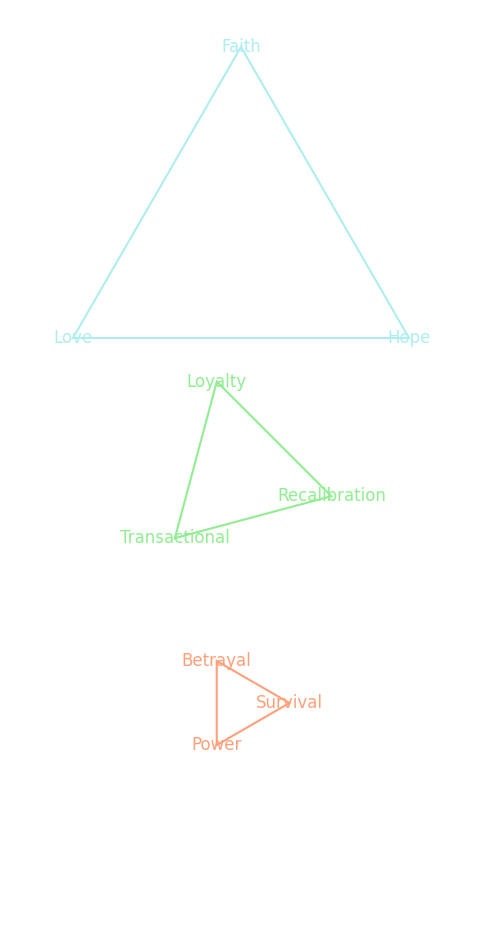
Fig. 37 The Descent of Man From Paradise to Hell. This book examines the arc of human experience from the fall to return. We ask: what strategic alliances does the fallen man seek? We explore the changes in equilibrium these alliances create, the payoffs they provide to the protagonist and allies, and the strategic interest underlying their choices 1#

