
Chapter 3#
Show code cell source
import networkx as nx
import matplotlib.pyplot as plt

# Creating a simplified directed acyclic graph (DAG) based on the clarified structure
G_simplified_dag = nx.DiGraph()

# Adding nodes
nodes_simplified = [
    "Economic & Environmental Inequity",
    "Racial & Ethnic Inequity",
    "Chronic Disability Inequity",
    "Access to Pediatric Rehabilitation",
    "Outcomes from Pediatric Rehabilitation",
    "Rehabilitation Service Utilization and Provision",
    "Decreased high quality care",
    "Decreased functional ability",
    "Increased morbidity"
]

# Adding edges based on the clarified structure
edges_simplified = [
    ("Economic & Environmental Inequity", "Access to Pediatric Rehabilitation"),
    ("Racial & Ethnic Inequity", "Access to Pediatric Rehabilitation"),
    ("Chronic Disability Inequity", "Access to Pediatric Rehabilitation"),
    ("Access to Pediatric Rehabilitation", "Outcomes from Pediatric Rehabilitation"),
    ("Outcomes from Pediatric Rehabilitation", "Rehabilitation Service Utilization and Provision"),
    ("Rehabilitation Service Utilization and Provision", "Decreased high quality care"),
    ("Rehabilitation Service Utilization and Provision", "Decreased functional ability"),
    ("Rehabilitation Service Utilization and Provision", "Increased morbidity")
]

# Adding the nodes and edges to the new simplified DAG
G_simplified_dag.add_nodes_from(nodes_simplified)
G_simplified_dag.add_edges_from(edges_simplified)

# Plotting the simplified DAG
plt.figure(figsize=(12, 12))
pos_simplified = nx.spring_layout(G_simplified_dag, seed=343)
nx.draw(G_simplified_dag, pos=pos_simplified, with_labels=True, node_color="lightblue", node_size=3000, edge_color="black", linewidths=1, font_size=10, font_weight="bold", arrows=True)
plt.title("Simplified DAG: Pediatric Rehabilitation Inequity Flow")
plt.show()
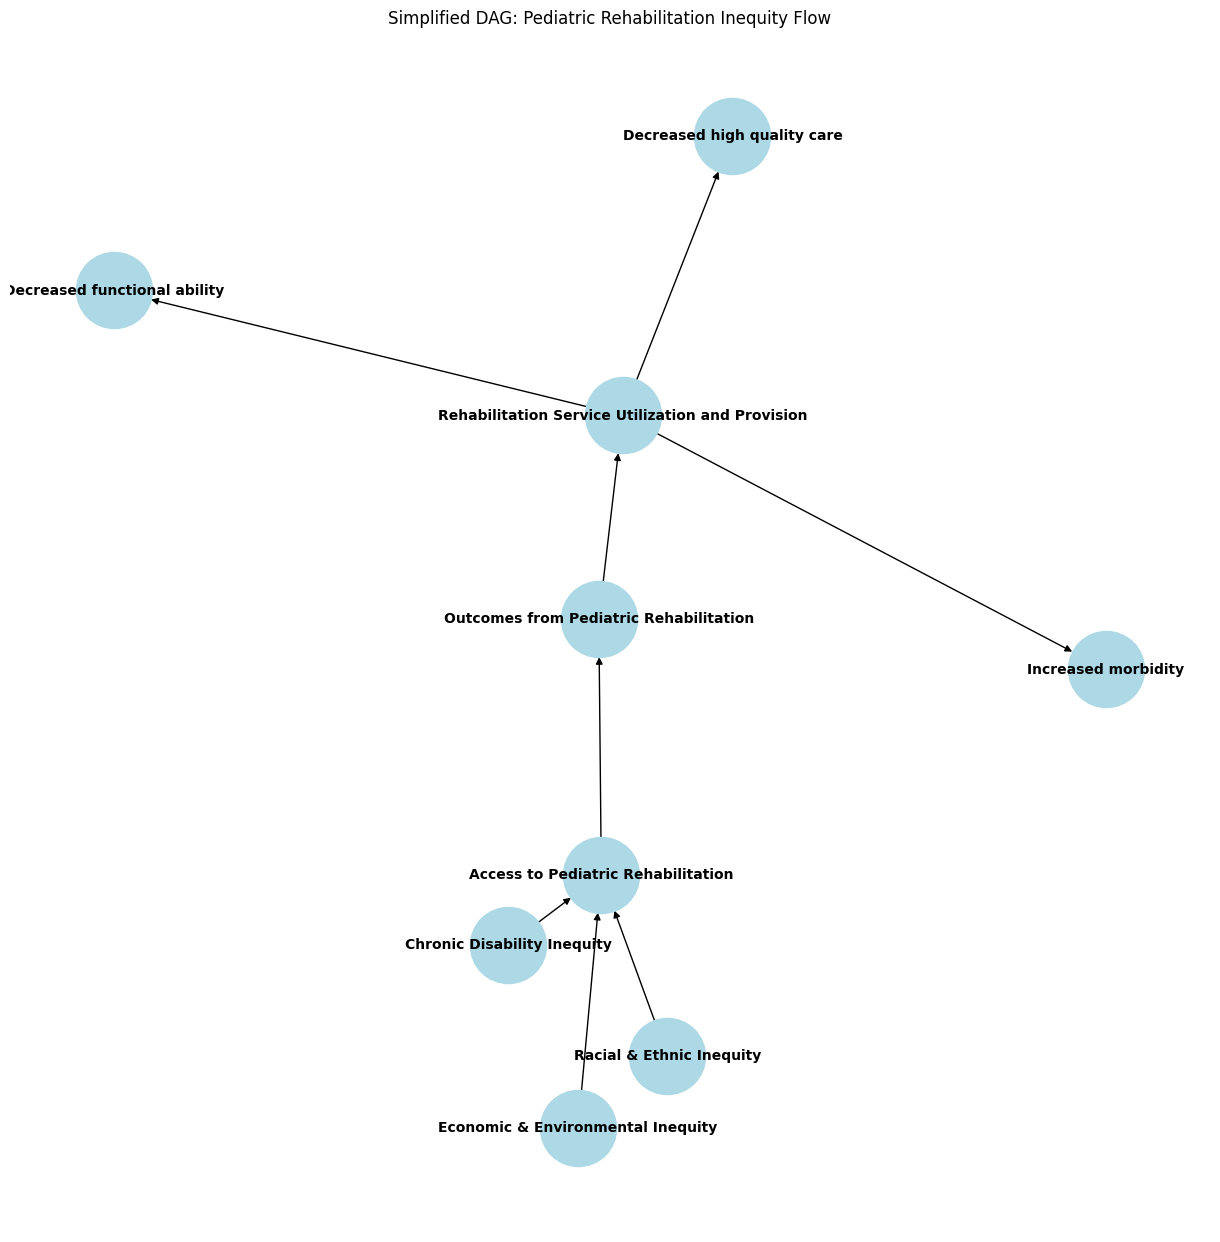

Fig. 20 Archetypal Directed Acyclic Graph. The general outline resembles my equilibrium DAG following 20-years of iteration! Of course I’ve reduced it to the essence, whereas the presenter included many details.#
Pediatric Rehabilitation Inequity Flow#
Key Factors#
Economic & Environmental Inequity
Racial & Ethnic Inequity
Chronic Disability Inequity
These contribute to limited access to pediatric rehabilitation services, resulting in:
Access to Pediatric Rehabilitation#
Decreased availability of service providers
Longer wait times to initiation of service
Decreased referral despite higher injury severity
Outcomes from Pediatric Rehabilitation#
Decreased motor and cognitive scores at discharge
Lower quality of life
Higher likelihood of functional deficit post injury
Rehabilitation Service Utilization & Provision#
Decreased utilization of mental health services
Decreased acute rehabilitation provision
Increased utilization of educational services and tools post injury
Final Consequences:#
Decreased high quality care
Decreased functional ability
Increased morbidity
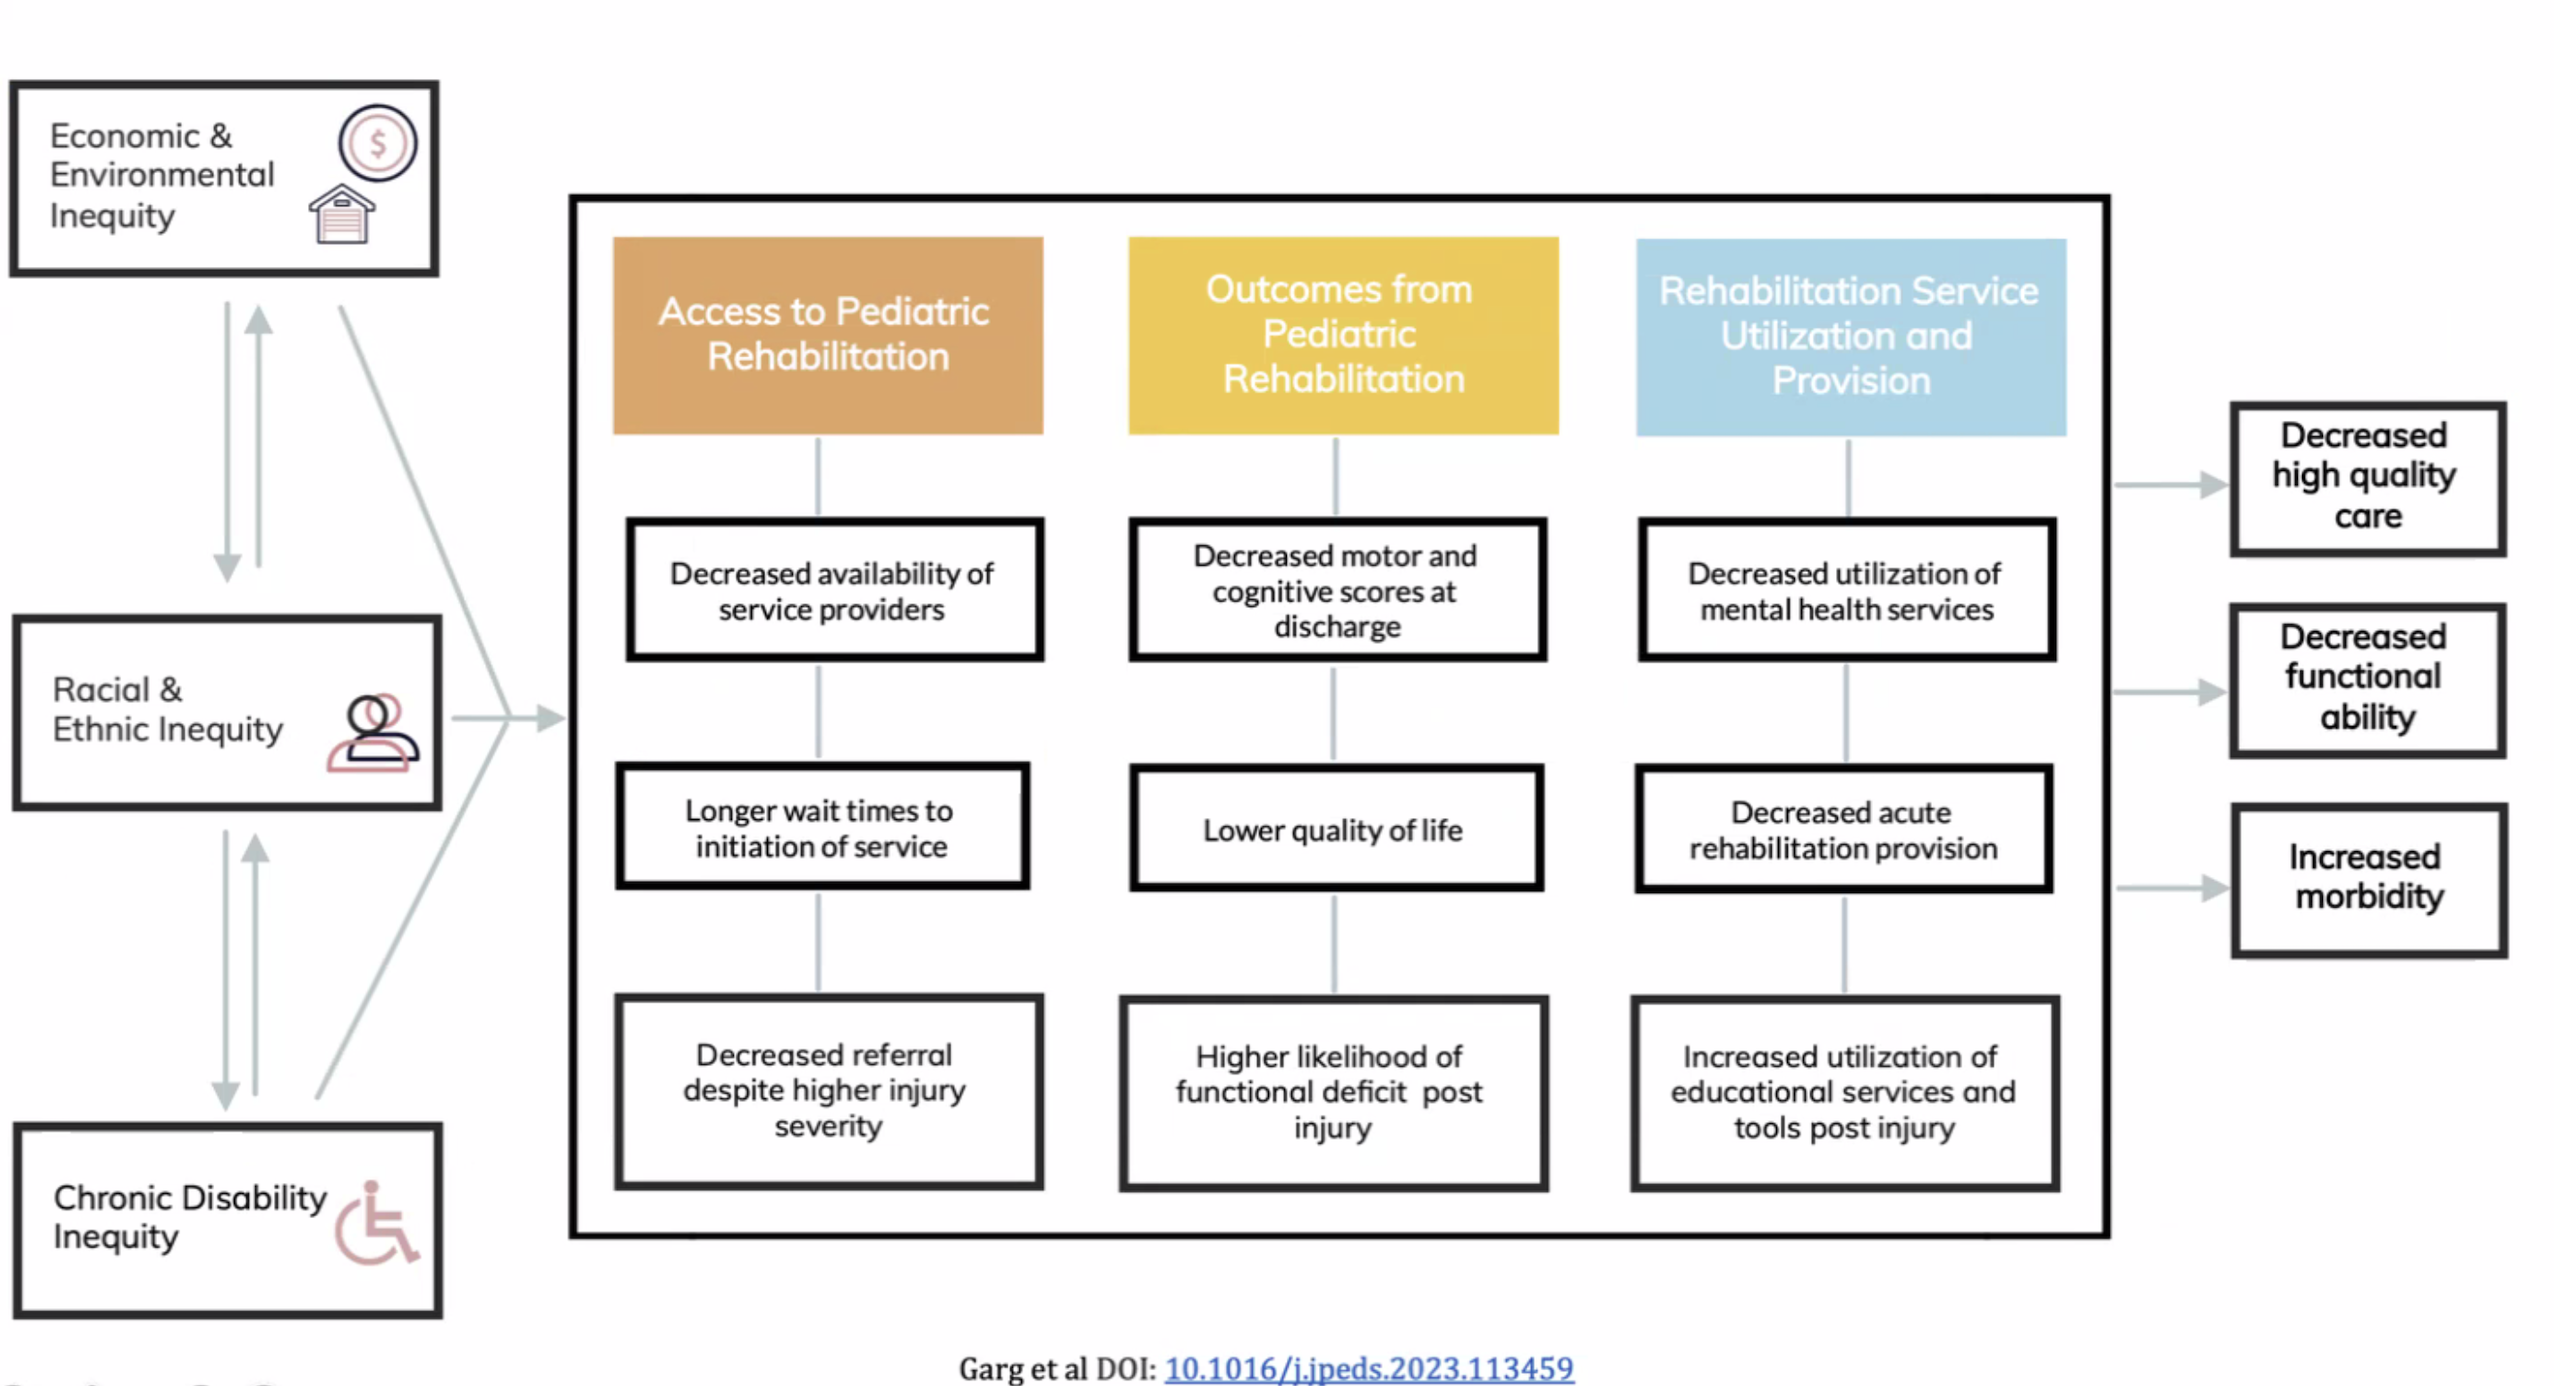
Fig. 21 Image Uploaded to GPT-4o. This gives me hope. Looks like I’ve been grappling with an archetype. So it should resonate with audiences in the clinical research space. Do you see games when you look at “Economic & Environmental Inequity”? How about allegory when you think of “Racial & Ethnic Inequity”? Certainly types when you consider “Chronic Disability Inequity”. “Access to Pediatric Rehabilitation” will be maximal under cooperative games, “Outcomes from Pediatric Rehabilitation” are best seen in context of aesthetic modes (think Clowns at Charlotte Bloomberg Childrens Center). “Rehabilitation Service Utilization and Provision” brings to mind prototypical arcs & our wish to bend destiny towards desired arcs#
Show code cell source
import networkx as nx
import matplotlib.pyplot as plt

# Creating a simplified directed acyclic graph (DAG) based on the clarified structure
G_simplified_dag = nx.DiGraph()

# Adding nodes
nodes_simplified = [
    "Allegory",
    "Type",
    "Games",
    "Archetype",
    "Stereotype",
    "Prototype",
    "Comical",
    "Tragical",
    "Historical"
]

# Adding edges based on the clarified structure
edges_simplified = [
    ("Allegory", "Archetype"),
    ("Type", "Archetype"),
    ("Games", "Archetype"),
    ("Archetype", "Stereotype"),
    ("Stereotype", "Prototype"),
    ("Prototype", "Comical"),
    ("Prototype", "Tragical"),
    ("Prototype", "Historical")
]

# Adding the nodes and edges to the new simplified DAG
G_simplified_dag.add_nodes_from(nodes_simplified)
G_simplified_dag.add_edges_from(edges_simplified)

# Plotting the simplified DAG
plt.figure(figsize=(12, 12))
pos_simplified = nx.spring_layout(G_simplified_dag, seed=343)
nx.draw(G_simplified_dag, pos=pos_simplified, with_labels=True, node_color="lightblue", node_size=3000, edge_color="black", linewidths=1, font_size=10, font_weight="bold", arrows=True)
plt.title("Simplified DAG: Pediatric Rehabilitation Inequity Flow")
plt.show()
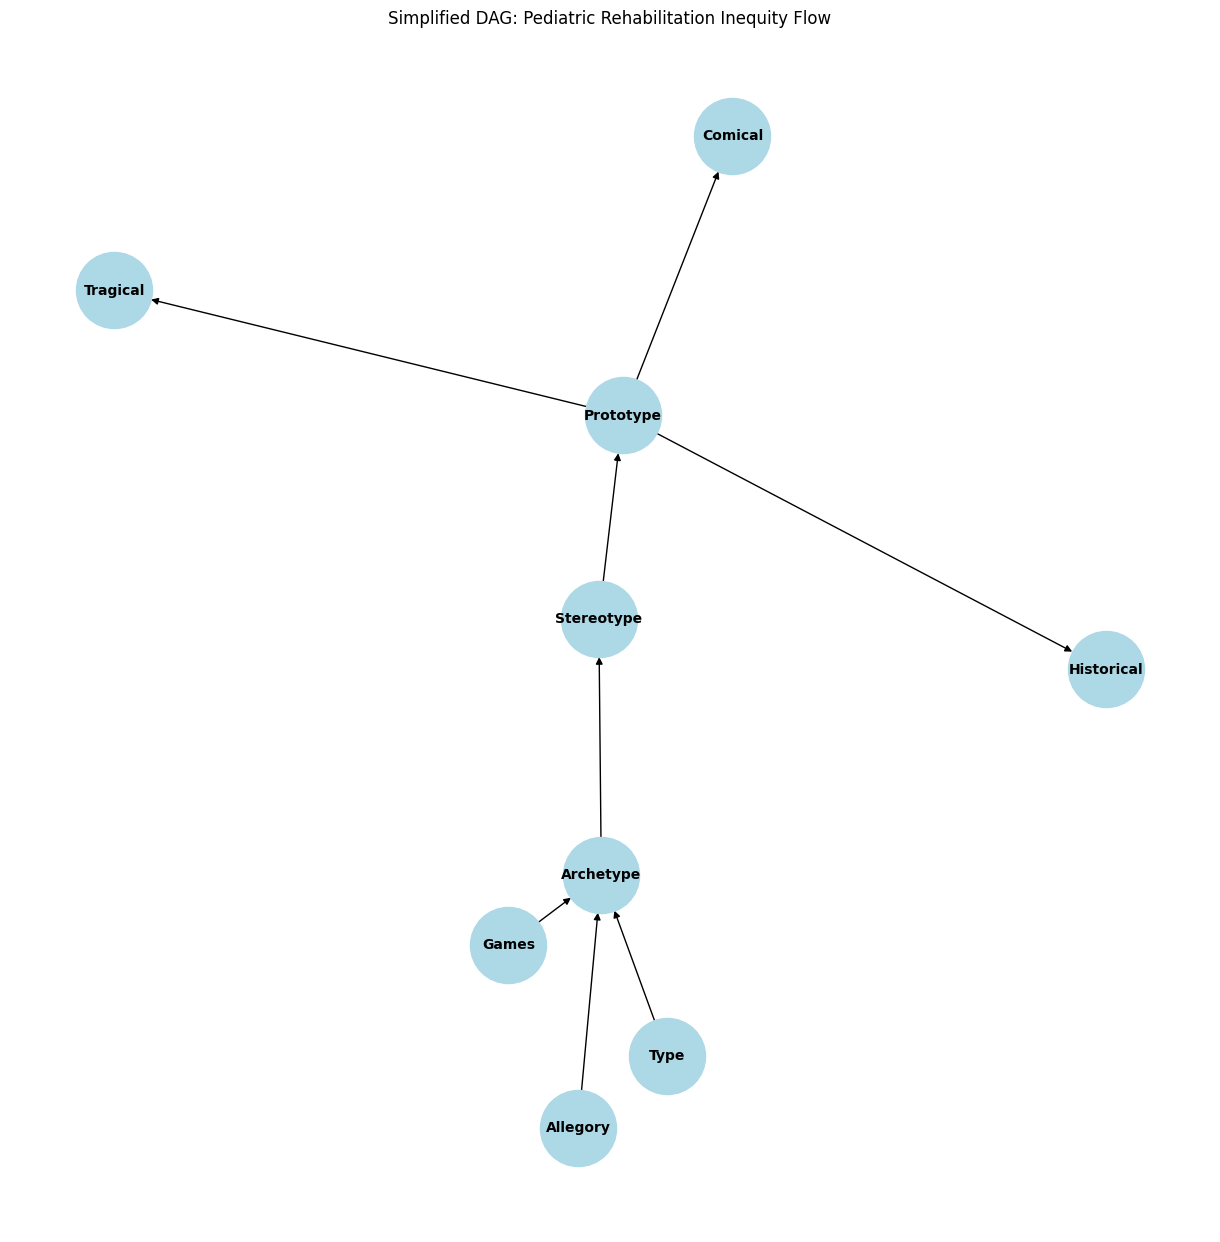
Fig. 22 Medicine-in-a-Nutshell, with Fractals. Ok, This is just the prototype. But we’ve unwittingly arrived here.#