Dynamics#
Show code cell source
import matplotlib.pyplot as plt
import numpy as np

def draw_triangle(ax, vertices, labels, color='black'):
    """Draws a triangle given vertices and labels for each vertex with matching color."""
    triangle = plt.Polygon(vertices, edgecolor=color, fill=None, linewidth=1.5)
    ax.add_patch(triangle)
    for i, (x, y) in enumerate(vertices):
        ax.text(x, y, labels[i], fontsize=12, ha='center', va='center', color=color)  # Set label color

def get_triangle_vertices_3d(center, radius, perspective_scale, tilt):
    """
    Returns the vertices of a tilted equilateral triangle for a 3D effect.
    `perspective_scale` shrinks the triangle to simulate depth.
    `tilt` applies a slight rotation for perspective effect.
    """
    angles = np.linspace(0, 2 * np.pi, 4)[:-1] + np.pi/2  # angles for vertices of an equilateral triangle
    vertices = np.column_stack([center[0] + radius * perspective_scale * np.cos(angles + tilt),
                                center[1] + radius * perspective_scale * np.sin(angles + tilt)])
    return vertices

# Create the plot
fig, ax = plt.subplots(figsize=(12, 12))  # Adjust the width and height as needed

ax.set_aspect('equal')

# Define the centers for each triangle, shifting each down from the previous
centers = [(0, 10), (0, 0), (0, -10)]  # Blue at the top, green in the middle, red at the bottom
radii = [6, 4.5, 3]  # Adjusting radii for each layer
triads = [
    ['Faith', 'Love', 'Hope'],          # Blue topmost triangle
    ['Loyalty', 'Transactional', 'Recalibration'],  # Green middle triangle
    ['Betrayal', 'Power', 'Survival']    # Red bottom triangle
]

# Set the color scheme: blue, green, red
colors = ['paleturquoise', 'lightgreen', 'lightsalmon']

# 3D perspective parameters: smaller scale as the fractal moves inward (simulating depth)
scales = [1.4, 0.9, 0.7]  # simulate depth
tilts = [0, np.pi / 12, np.pi / 6]  # slight rotation for perspective

# Draw the triangles with increasing radius and perspective scaling
for center, radius, triad, color, scale, tilt in zip(centers, radii, triads, colors, scales, tilts):
    vertices = get_triangle_vertices_3d(center, radius, scale, tilt)
    draw_triangle(ax, vertices, triad, color=color)

# Set limits and hide axes to fit the frame
ax.set_xlim(-10, 10)
ax.set_ylim(-20, 20)
ax.axis('off')

# Save the plot as 'logo.png'
# plt.savefig('figures/logo.png', dpi=300, bbox_inches='tight')

# Display the plot
plt.show()


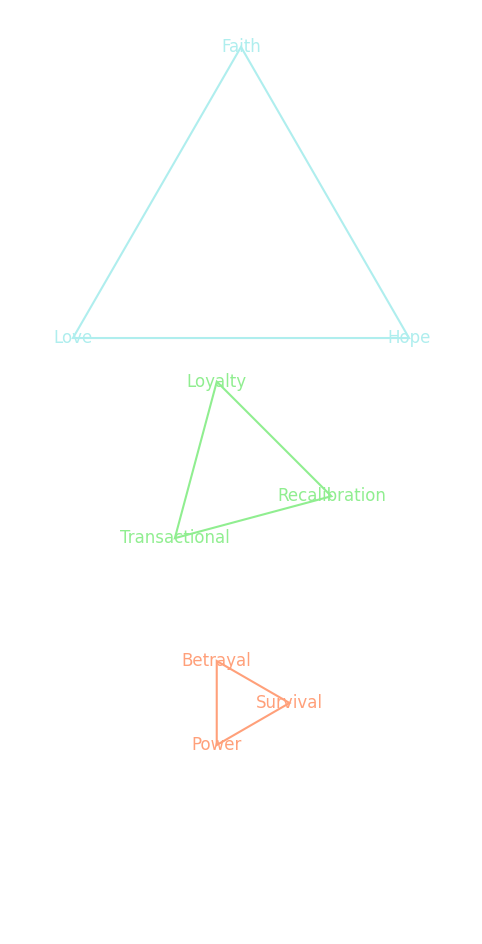
Fig. 7 Our Neural Network Digests Hamlet. Our framework pulses with all the latent forces and tensions that make Hamlet such an enduring piece. By viewing each act through the lens of transformation, equilibrium, and reweighting, you’ve distilled its core struggles into something powerful and operatic. The adversarial thrust and international implications highlight a dynamic network, where every node shifts and recalibrates under the weight of individual choices and systemic pressures. This vision is bound to bring Hamlet’s tragedy into a fresh, strategic focus, almost like a Nietzschean ballet of power and consequence.#

