
Natural#
Show code cell source
import matplotlib.pyplot as plt
from wordcloud import WordCloud

# Define the text with the word translations for "Hello"
text = """Hello Hi Salut Bonjour Hallo Ola Ciao Hola Guten Tag Saluton Kamusta Merhaba Здравствуйте Elo Aloha Terve
          Opa Вітаю 오늘은 Ciau 今日は سلام Здрасти 你好 سلامة"""

# Define the word frequencies if specific sizes are required
word_freqs = {
    "Kodheyo": 20,
    "Hi": 8,
    "Salut": 7,
    "Bonjour": 7,
    "Hallo": 6,
    "Ola": 6,
    "Ciao": 5,
    "Hola": 5,
    "Guten Tag": 4,
    "Saluton": 4,
    "Kamusta": 4,
    "Merhaba": 3,
    "Здравствуйте": 3,
    "Elo": 3,
    "Aloha": 3,
    "Terve": 3,
    "Opa": 2,
    "Вітаю": 2,
    "오늘은": 2,
    "Ciau": 2,
    "今日は": 2,
    "سلام": 2,
    "Здрасти": 4,
    "你好": 2,
    "سلامة": 2
}

# Create the word cloud object
wordcloud = WordCloud(width=1000, height=800, background_color='white', relative_scaling=0.5,
                      colormap='viridis', collocations=False).generate_from_frequencies(word_freqs)

# Plot the word cloud
plt.figure(figsize=(10, 5))
plt.imshow(wordcloud, interpolation='bilinear')
plt.axis('off')
plt.show()
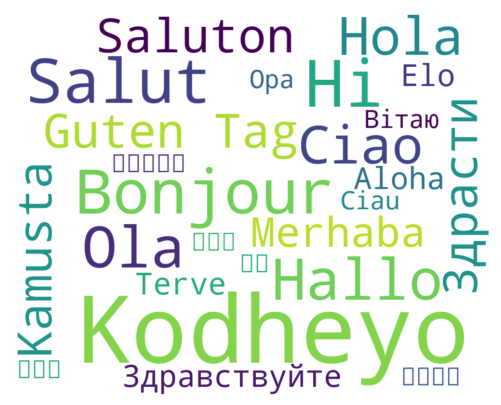
Python has an amazing suit of libraries that R and Stata can’t match. Just upload an image to GPT-4o and ask it to produce code that mimics what you’re looking at. Thats how I got the above wordcloud script. Simple!