
R#
![]()
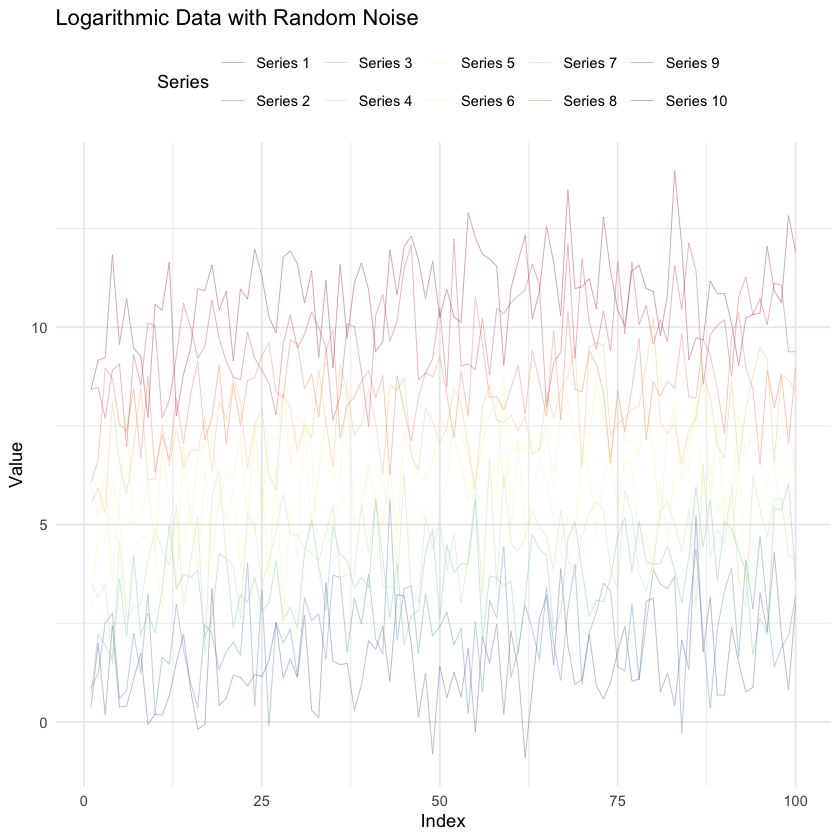
GPT-4o assisted translation of Python code from previous chapter
Show code cell source
# Set working directory (adjust to your specific path)
setwd("~/documents/athena/multilingual/")

# Install necessary packages if not already installed
suppressWarnings({
  if (!requireNamespace("ggplot2", quietly = TRUE)) install.packages("ggplot2")
  if (!requireNamespace("RColorBrewer", quietly = TRUE)) install.packages("RColorBrewer")
  if (!requireNamespace("reshape2", quietly = TRUE)) install.packages("reshape2")
})

# Load necessary libraries
suppressWarnings({
  library(ggplot2)
  library(RColorBrewer)
  library(reshape2)
})

# Set seed for reproducibility
set.seed(19680801)

# Generate data
N <- 10
data <- sapply(0:(N-1), function(ii) log10(seq(1, 100, length.out = 100)) + rnorm(100) + ii)

# Convert data to a data frame for ggplot2
df <- as.data.frame(data)
df$index <- 1:100
df_long <- suppressWarnings(melt(df, id.vars = "index"))

# Create a custom color palette
colors <- colorRampPalette(rev(brewer.pal(11, "Spectral")))(N)

# Plot the data
p <- suppressWarnings(ggplot(df_long, aes(x = index, y = value, color = factor(variable))) +
  geom_line(size = 0.1) +
  scale_color_manual(values = colors, name = "Series",
                     labels = paste0("Series ", 1:N)) +
  theme_minimal() +
  theme(legend.position = "top") +
  labs(title = "Logarithmic Data with Random Noise",
       x = "Index",
       y = "Value"))

# Display the plot
suppressWarnings(print(p))

# Save the plot with a wider aspect ratio
suppressWarnings(ggsave("r.png", plot = p, width = 20, height = 10))
There is a lot more that you can do with outputs (such as including interactive outputs) with your book. For more information about this, see the Jupyter Book documentation