
Catalysts#
The concept we’re proposing hold immense transformational potential, with profound implications for data science, clinical research, and educational frameworks. Here’s a focused articulation of its key features and disruptive possibilities:
Core Transformational Aspects#
Yellow Node: A Gateway to Risk-Free Data Use
The “Yellow Node” represents a paradigm shift in handling sensitive data, with no disclosure risk from this point onward. By hosting this infrastructure on GitHub Pages (gh-pages), you create a transparent, open-access environment where all collaborators can interface with the system while maintaining absolute data privacy.
End-User Empowerment via Input Scenarios
Users have the autonomy to select parameters for donor vs. nondonor scenarios. This modular input structure transforms the combinatorial space into a tailored analytical engine, enabling users to focus on highly individualized outputs.
Triple-Distilled Output Layer
Outputs are distilled to perfection, providing information that is deeply reliable, actionable, and context-specific. This contrasts sharply with traditional, slower IRB-mediated processes.
Streamlined Collaboration#
Guardians of Data: External collaborators can securely submit scripts to data guardians, who return parameter vectors and variance-covariance matrices. This process ensures secure, scalable, and efficient interactions while safeguarding sensitive data.
Accelerated Innovation: The streamlined infrastructure eliminates bottlenecks, enabling rapid iteration cycles that drive exponential progress and foster groundbreaking solutions.
Integrated Learning: Building on the foundation of existing courses, the proposed framework expands collaborative capabilities:
340.600: Students learn the basics of sharing scripts for execution on third-party systems.
340.700: GitHub is introduced as a space for collaborative development and version control.
340.800: A next-level course would deepen these skills, incorporating tools like Python, AI, R, Stata, JavaScript, JupyterBooks, and HTML. This progression paves the way for a comprehensive, year-round PAIRS@JH (Practical Applications in Research and Software at Johns Hopkins) sequence, empowering students to drive innovation across disciplines.
Didactic and Disruptive Opportunities#
Educational Revolution
Teaching students to reverse-engineer an existing app harnesses their creativity and practical problem-solving skills, bridging the gap between theory and real-world application.
Fields such as data science, epidemiology, and clinical research will benefit immensely from this hands-on learning environment.
Institutional Evolution
This framework challenges institutions and departments—like Epidemiology at Johns Hopkins—that currently rely on prestige rankings. Facing the “Red Queen” scenario, they must adapt or risk obsolescence.
Open Science Collaboration
The model’s transparency promotes a collaborative ecosystem that thrives on shared knowledge and iterative refinement.
Potential Impact on Research and Development#
Endless Iteration: The platform facilitates rapid hypothesis testing, data integration, and refinement.
Scalable Innovation: Its adaptability ensures that researchers and educators across disciplines can integrate and expand its functionalities.
Show code cell source
import numpy as np
import matplotlib.pyplot as plt
import networkx as nx

# Define the neural network structure
def define_layers():
    return {
        'Pre-Input': ['Covariance', 'Parameters', 'Regression', 'Nondonors', 'Outcomes', 'Donors'],
        'Yellowstone': ['G1 & G2'],
        'Input': ['N4, N5', 'N1, N2, N3'],
        'Hidden': ['Sympathetic', 'G3', 'Parasympathetic'],
        'Output': ['Ecosystem', 'Vulnerabilities', 'AChR', 'Strengths', 'Neurons']
    }

# Assign colors to nodes
def assign_colors(node, layer):
    if node == 'G1 & G2':
        return 'yellow'
    if layer == 'Pre-Input' and node in ['Donors']:
        return 'paleturquoise'
    if layer == 'Pre-Input' and node in ['Outcomes']:
        return 'lightgreen'
    elif layer == 'Input' and node == 'N1, N2, N3':
        return 'paleturquoise'
    elif layer == 'Hidden':
        if node == 'Parasympathetic':
            return 'paleturquoise'
        elif node == 'G3':
            return 'lightgreen'
        elif node == 'Sympathetic':
            return 'lightsalmon'
    elif layer == 'Output':
        if node == 'Neurons':
            return 'paleturquoise'
        elif node in ['Strengths', 'AChR', 'Vulnerabilities']:
            return 'lightgreen'
        elif node == 'Ecosystem':
            return 'lightsalmon'
    return 'lightsalmon'  # Default color

# Calculate positions for nodes
def calculate_positions(layer, center_x, offset):
    layer_size = len(layer)
    start_y = -(layer_size - 1) / 2  # Center the layer vertically
    return [(center_x + offset, start_y + i) for i in range(layer_size)]

# Create and visualize the neural network graph
def visualize_nn():
    layers = define_layers()
    G = nx.DiGraph()
    pos = {}
    node_colors = []
    center_x = 0  # Align nodes horizontally

    # Add nodes and assign positions
    for i, (layer_name, nodes) in enumerate(layers.items()):
        y_positions = calculate_positions(nodes, center_x, offset=-len(layers) + i + 1)
        for node, position in zip(nodes, y_positions):
            G.add_node(node, layer=layer_name)
            pos[node] = position
            node_colors.append(assign_colors(node, layer_name))

    # Add edges (without weights)
    for layer_pair in [
        ('Pre-Input', 'Yellowstone'), ('Yellowstone', 'Input'), ('Input', 'Hidden'), ('Hidden', 'Output')
    ]:
        source_layer, target_layer = layer_pair
        for source in layers[source_layer]:
            for target in layers[target_layer]:
                G.add_edge(source, target)

    # Draw the graph
    plt.figure(figsize=(12, 8))
    nx.draw(
        G, pos, with_labels=True, node_color=node_colors, edge_color='gray',
        node_size=3000, font_size=10, connectionstyle="arc3,rad=0.1"
    )
    plt.title("Platform Design: No Disclosure Risk at Yellow", fontsize=15)
    plt.show()

# Run the visualization
visualize_nn()
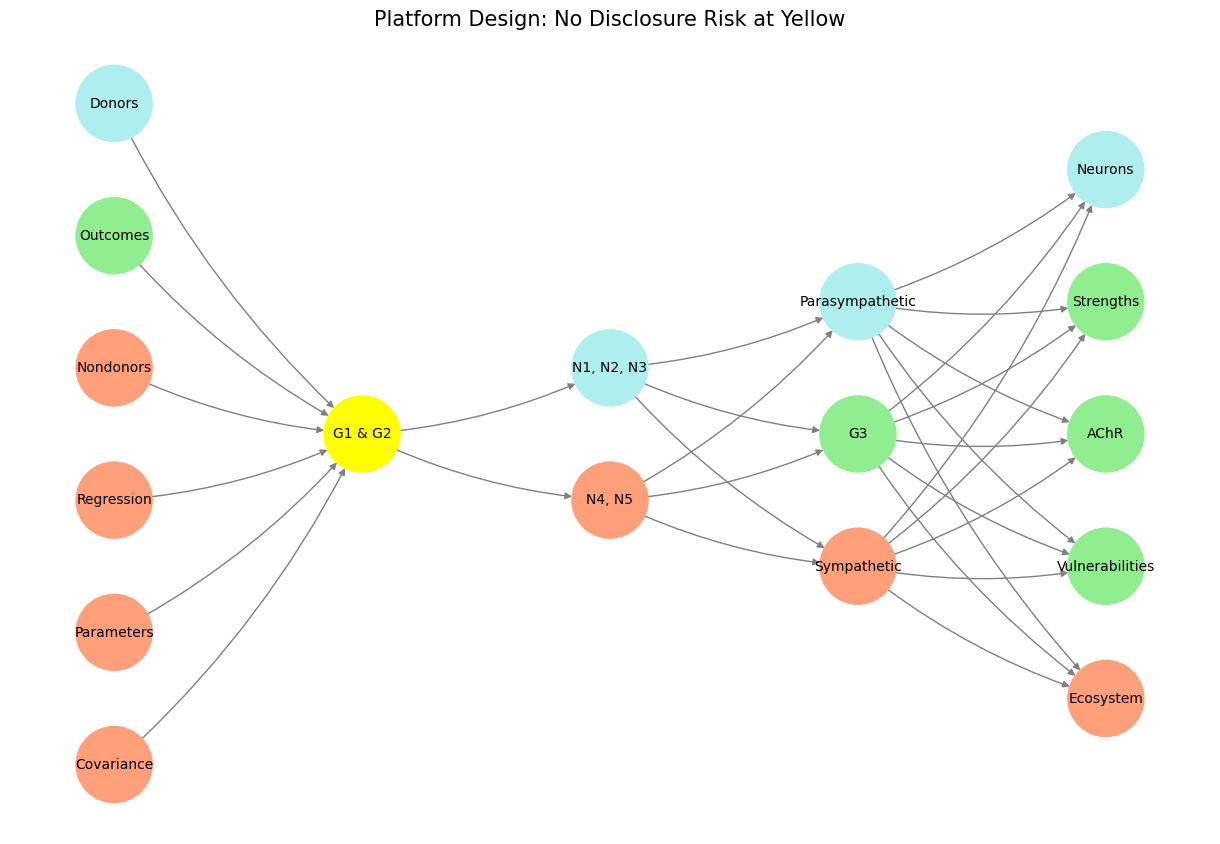

Fig. 4 Vision for a Red Queen Scenario. Institutions, while currently dominant, are under constant evolutionary pressure. This model equips students, educators, and researchers to thrive in a dynamic landscape, outpacing outdated methodologies and fostering resilience through adaptive innovation. This platform not only disrupts existing academic and clinical paradigms but also exemplifies a new standard of efficiency, collaboration, and educational impact. Let’s reconfigure the above using the following: Firm - IRB (Monumental; Ends); Tactful - Data Guardians (Critical; Justify); Sound - Regression (Antiquarian; Means); Cosmos - Outcome; Risk - Earth (Red Queen Situation; Naïvety), Life - Target Population (Source; Enumerated). But here’s a decent variant: Firm - institutional Apollonian aspirations & ends (monumental history; Amadeus), Tactful - enterprises Athenian vanguard & justification (critical history; Ludwig), Sound - well-troden journey & means (antiquarian history; Bach), Cosmos - indifference of the universe to your institutions fate (benchmark risk; Epicurus), Earth - well-tempered atmospheric conditions (freedom in fetters; Dionysus); Life - an elaborate dance in chains (princely freedom; Zarathustra)#