
Now Lets Get Down to Technical Stuff#
Let’s start by reproducing some old results
Old results#
Source population#
Extract vector-matrix#
Show code cell source
qui {
capture log close
log using jamascript.log, replace
global repo https://github.com/muzaale/forum/raw/main/
/*--Edit this Line --*/
global dir ~/documents/liveserver/age/
// cls; some commands don't work outside Stata!!
/*noi di "What is your work directory?" _request(workdir)
if "$workdir" == "" {
di as err "Please provide your work directory"
exit
}
else {
cd $workdir
noi di "jamascript is running ..."
}
*/
use ${repo}esrdRisk_t02tT, clear
tab donor rSMGJcEdF_d
g entry = rSMGJcEdF_t0
//linkage for donors after 2011 is untrustworthy
replace rSMGJcEdF_d=0 if rSMGJcEdF_tT > d(31dec2011)
replace rSMGJcEdF_tT = d(31dec2011) if rSMGJcEdF_tT > d(31dec2011)
//linkage before 1994 is untrustworthy
#delimit ;
replace entry = d(01jan1994) if
entry < d(01jan1994) &
rSMGJcEdF_tT > d(01jan1994);
stset rSMGJcEdF_tT,
origin(rSMGJcEdF_t0)
entry(`entry')
fail(rSMGJcEdF_d==2)
scale(365.25);
#delimit cr
sts list, fail by(donor) at(5 12 15) saving(km, replace )
preserve
use km, clear
replace failure=failure*100
sum failure if donor==1 & time==5
local don5y: di %3.2f r(mean)
sum failure if donor==1 & time==12
local don12y: di %3.2f r(mean)
sum failure if donor==1 & time==15
local don15y: di %3.2f r(mean)
//
sum failure if donor==2 & time==5
local hnd5y: di %3.2f r(mean)
sum failure if donor==2 & time==12
local hnd12y: di %3.2f r(mean)
sum failure if donor==2 & time==15
local hnd15y: di %3.2f r(mean)
//
sum failure if donor==3 & time==5
local gpop5y: di %3.2f r(mean)
sum failure if donor==3 & time==12
local gpop12y: di %3.2f r(mean)
sum failure if donor==3 & time==15
local gpop15y: di %3.2f r(mean)
restore
#delimit ;
sts graph,
by(donor)
fail
per(100)
xlab(0(3)15)
ylab(0(10)40,
format(%2.0f))
tmax(15)
risktable(, color(stc1) group (1)
order(3 " " 2 " " 1 " ")
ti("#")
)
risktable(, color(stc2) group(2))
risktable(, color(stc3) group(3))
legend(on
ring(0)
pos(11)
order(3 2 1)
lab(3 "General population")
lab(2 "Healthy nondonor")
lab(1 "Living donor")
)
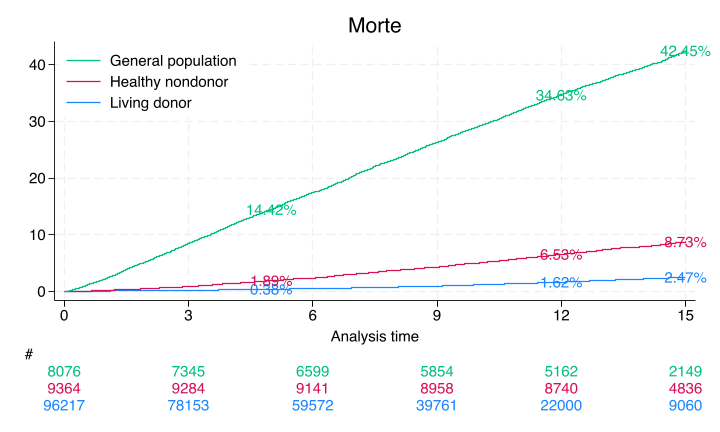
ti("Morte")
text(`don5y' 5 "`don5y'%", col(stc1))
text(`don12y' 12 "`don12y'%", col(stc1))
text(`don15y' 15 "`don15y'%", col(stc1))
text(`hnd5y' 5 "`hnd5y'%", col(stc2))
text(`hnd12y' 12 "`hnd12y'%", col(stc2))
text(`hnd15y' 15 "`hnd15y'%", col(stc2))
text(`gpop5y' 5 "`gpop5y'%", col(stc3))
text(`gpop12y' 12 "`gpop12y'%", col(stc3))
text(`gpop15y' 15 "`gpop15y'%", col(stc3));
#delimit cr
graph export ${dir}jamascript.png, replace
keep _* entry age_t0 female race donor
rename age_t0 age
//dataset
save ${dir}jamascript.dta, replace
noi stcox i.donor, basesurv(s0)
noi list s0 _t donor in 1/10
matrix define b=e(b)
keep s0 _t
//s0
sort _t s0
list in 1/10
save ${dir}s0.dta, replace
export delimited using ${dir}s0.csv, replace
matrix beta = e(b)
svmat beta
keep beta*
drop if missing(beta1)
//betas
list
save b.dta, replace
export delimited using ${dir}b.csv, replace
log close
//noi ls
}
Show code cell output
Failure _d: rSMGJcEdF_d==2
Analysis time _t: (rSMGJcEdF_tT-origin)/365.25
Origin: time rSMGJcEdF_t0
Iteration 0: Log likelihood = -54332.522
Iteration 1: Log likelihood = -52993.14
Iteration 2: Log likelihood = -51472.516
Iteration 3: Log likelihood = -49543.907
Iteration 4: Log likelihood = -49520.68
Iteration 5: Log likelihood = -49520.548
Iteration 6: Log likelihood = -49520.548
Refining estimates:
Iteration 0: Log likelihood = -49520.548
Cox regression with Breslow method for ties
No. of subjects = 113,657 Number of obs = 113,657
No. of failures = 4,937
Time at risk = 999,633.484
LR chi2(2) = 9623.95
Log likelihood = -49520.548 Prob > chi2 = 0.0000
-------------------------------------------------------------------------------
_t | Haz. ratio Std. err. z P>|z| [95% conf. interval]
--------------+----------------------------------------------------------------
donor |
HealthyNon~r | 4.341779 .2130915 29.92 0.000 3.943586 4.780178
NotSoHealt~r | 26.88098 1.007964 87.78 0.000 24.97625 28.93096
-------------------------------------------------------------------------------
+-------------------------------+
| s0 _t donor |
|-------------------------------|
1. | .98566928 11.277207 Donor |
2. | .99256749 6.8281999 Donor |
3. | .99351642 6.1711157 Donor |
4. | .99402483 5.6919918 Donor |
5. | .98475171 11.816564 Donor |
|-------------------------------|
6. | .99934972 .90622861 Donor |
7. | .98705221 10.472279 Donor |
8. | .9879412 9.8754278 Donor |
9. | .98766713 10.064339 Donor |
10. | .99994059 .08761123 Donor |
+-------------------------------+
#
Show code cell source
qui {
use ${repo}esrdRisk_t02tT, clear
tab donor rSMGJcEdF_d
g entry = rSMGJcEdF_t0
//linkage for donors after 2011 is untrustworthy
replace rSMGJcEdF_d=0 if rSMGJcEdF_tT > d(31dec2011)
replace rSMGJcEdF_tT = d(31dec2011) if rSMGJcEdF_tT > d(31dec2011)
//linkage before 1994 is untrustworthy
#delimit ;
replace entry = d(01jan1994) if
    entry < d(01jan1994) &
	rSMGJcEdF_tT > d(01jan1994);
stset rSMGJcEdF_tT,
    origin(rSMGJcEdF_t0)
	entry(`entry')
	fail(rSMGJcEdF_d==2)
	scale(365.25);

#delimit cr

stcox i.donor don_age don_female i.don_race i.don_educat don_hyperten don_smoke don_bmi don_bp_preop_syst  don_egfr if inlist(donor,1,2), basesurv(s0_v1)

export delimited _t s0_v1 using "~/documents/liveserver/age/s0_v1.csv", replace

tab donor if !missing(s0_v1)

matrix define m=e(b)
matrix list m
di exp(m[1,2])
svmat m
list m*
keep m*
drop if missing(m1)
export delimited using "don_nondon_v1.csv", replace
}
To create a CSV of the coefficient vector in Stata, you’ll need to extract the matrix and then export it to a CSV file. Here’s how you can do it: