
Transvaluation#
The code snippet you’ve provided appears to be a Python script aimed at visualizing a complex, metaphorical representation of neural networks, possibly as a metaphor for understanding or critiquing socio-political dynamics or personal philosophies related to figures like Donald Trump and Elon Musk. Here’s a speculative exploration of what this visualization might represent:
At its core, the script defines a fractal-like neural network where each layer represents different dimensions or aspects of existence, cognition, and perhaps political or entrepreneurial strategy. The layers titled “World,” “Mode,” “Agent,” “Space,” and “Time” suggest a deep, layered approach to understanding human behavior, decision-making, and systemic interactions.
Fig. 19 What Exactly is Identity. A node may represent goats (in general) and another sheep (in general). But the identity of any specific animal (not its species) is a network. For this reason we might have a “black sheep”, distinct in certain ways – perhaps more like a goat than other sheep. But that’s all dull stuff. Mistaken identity is often the fuel of comedy, usually when the adversarial is mistaken for the cooperative or even the transactional.#
World: This layer might symbolize the external environment or the macro-scale influences affecting individuals or leaders like Trump and Musk. Terms like “Electro,” “Magnetic,” “Pulse,” “Cost,” “Trial,” and “Error” could represent the chaotic, dynamic forces at play in politics or business, where decisions are made based on trial and error, costs, and the push and pull of various forces (electro-magnetic might metaphorically refer to the attraction or repulsion of ideas, policies, or strategies).
Mode: With only “Reflexive” as its node, this could imply a mode of operation where actions are immediate responses to stimuli, akin to how Trump might react to media or how Musk might respond to market changes, focusing on reflexes rather than long-term strategy. Agent: Here, “Ascending” and “Descending” might denote the personal or strategic journeys of leaders - ascending in power, influence, or success, or descending due to failures or controversies. This duality could reflect the volatile nature of public and business life where one can quickly rise or fall.
Space: The nodes “Sympathetic,” “Empathetic,” and “Parasympathetic” suggest emotional or psychological states or strategies. In a political or business context, this might reflect how leaders connect with or understand their audience, followers, or the market, balancing empathy with strategic or even manipulative sympathy. Time: This layer with terms like “Hardcoded,” “Posteriori,” “Meaning,” “Likelihood,” and “A Priori” indicates a temporal dimension where decisions are made based on past experiences (a posteriori), inherent beliefs (a priori), or calculated risks (likelihood). “Hardcoded” might refer to immutable personal traits or strategies of the individuals.
The use of colors in the nodes, assigned through the assign_colors() function, might be an attempt to categorize or visualize the emotional or strategic impact of each node. For instance, “yellow” for “Reflexive” could denote caution or alertness, “paleturquoise” for concepts like “Error” might suggest calmness or acceptance of mistakes, and “lightsalmon” for proactive or aggressive strategies like “Pulse” or “Hardcoded.”
The visualization itself, with directed edges connecting nodes from one layer to the next, creates a flow that could be interpreted as how influence, decisions, or even personal traits cascade through different aspects of one’s life or leadership. The title “Trump & Musk According to GPT” hints that this might be an AI-generated interpretation of how these two figures might operate within their realms, based on data and patterns analyzed by a language model like GPT.
In summary, this code might be an artistic and analytical exercise to diagrammatically represent the complex interplay of personal traits, strategic decisions, and external influences that define the public personas and operational styles of notable figures, using the metaphor of a neural network to explore these dynamics in a visually and conceptually rich manner.
Show code cell source
import numpy as np
import matplotlib.pyplot as plt
import networkx as nx

# Define the neural network fractal
def define_layers():
    return {
        'World': ['Electro', 'Magnetic', 'Pulse', 'Cost', 'Trial', 'Error', ], # Veni; 95/5
        'Mode': ['Reflexive'], # Vidi; 80/20
        'Agent': ['Ascending', 'Descending'], # Vici; Veni; 51/49
        'Space': ['Sympathetic', 'Empathetic', 'Parasympathetic'], # Vidi; 20/80
        'Time': ['Hardcoded', 'Posteriori',  'Meaning', 'Likelihood', 'A Priori'] # Vici; 5/95
    }

# Assign colors to nodes
def assign_colors():
    color_map = {
        'yellow': ['Reflexive'],
        'paleturquoise': ['Error', 'Descending', 'Parasympathetic', 'A Priori'],
        'lightgreen': ['Trial', 'Empathetic', 'Likelihood', 'Meaning', 'Posteriori'],
        'lightsalmon': [
            'Pulse', 'Cost', 'Ascending',
            'Sympathetic', 'Hardcoded'
        ],
    }
    return {node: color for color, nodes in color_map.items() for node in nodes}

# Calculate positions for nodes
def calculate_positions(layer, x_offset):
    y_positions = np.linspace(-len(layer) / 2, len(layer) / 2, len(layer))
    return [(x_offset, y) for y in y_positions]

# Create and visualize the neural network graph
def visualize_nn():
    layers = define_layers()
    colors = assign_colors()
    G = nx.DiGraph()
    pos = {}
    node_colors = []

    # Add nodes and assign positions
    for i, (layer_name, nodes) in enumerate(layers.items()):
        positions = calculate_positions(nodes, x_offset=i * 2)
        for node, position in zip(nodes, positions):
            G.add_node(node, layer=layer_name)
            pos[node] = position
            node_colors.append(colors.get(node, 'lightgray'))

    # Add edges (automated for consecutive layers)
    layer_names = list(layers.keys())
    for i in range(len(layer_names) - 1):
        source_layer, target_layer = layer_names[i], layer_names[i + 1]
        for source in layers[source_layer]:
            for target in layers[target_layer]:
                G.add_edge(source, target)

    # Draw the graph
    plt.figure(figsize=(12, 8))
    nx.draw(
        G, pos, with_labels=True, node_color=node_colors, edge_color='gray',
        node_size=3000, font_size=9, connectionstyle="arc3,rad=0.2"
    )
    plt.title("Trump & Musk According to Grok", fontsize=15)
    plt.show()

# Run the visualization
visualize_nn()
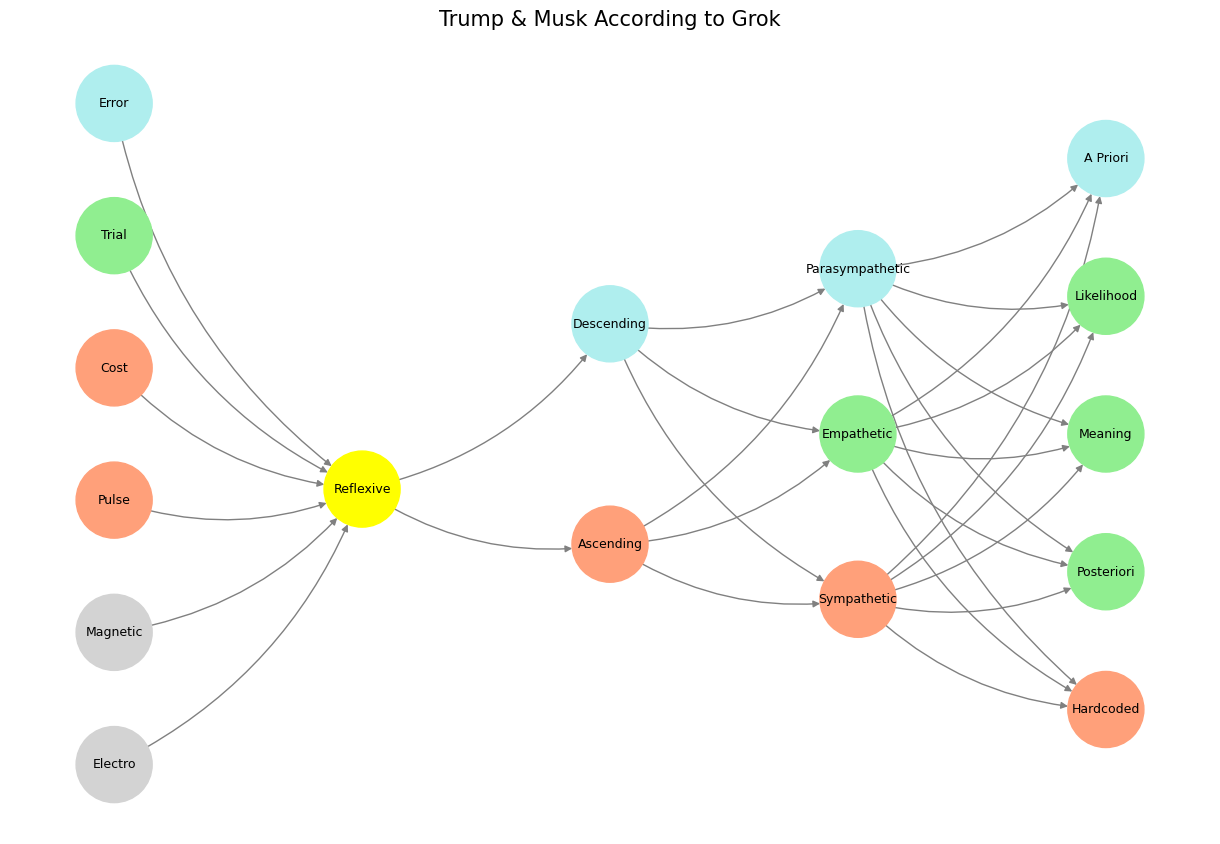
Fig. 20 Nvidia vs. Music. APIs between Nvidias CUDA & their clients (yellowstone node: G1 & G2) are here replaced by the ear-drum & vestibular apparatus. The chief enterprise in music is listening and responding (N1, N2, N3) as well as coordination and syncronization with others too (N4 & N5). Whether its classical or improvisational and participatory, a massive and infinite combinatorial landscape is available for composer, maestro, performer, audience. And who are we to say what exactly music optimizes?#