Kernel#
The issue seems to be that R is not found in your current PATH, which is necessary for running R from the terminal. This might be because R is not installed in the virtual environment or the path to the system-wide R installation is not included in your PATH.
Here are the steps to resolve this:
Step 1: Ensure R is Installed and Accessible#
Check if R is installed system-wide:
which RThis should return the path to the R executable, such as
/usr/local/bin/R. If it doesn’t, you may need to install R.Install R (if not already installed):
Download and install R from CRAN.
Step 2: Add R to the PATH`#
Find the path to the R executable:
which RAssume it returns
/usr/local/bin/R.Add the R path to your PATH environment variable:
export PATH=/usr/local/bin:$PATH`
Add the R path to your shell configuration file (
~/.zshrcif you are using zsh):echo 'export PATH=/usr/local/bin:$PATH' >> ~/.zshrc
Reload the shell configuration file:
source ~/.zshrc
Step 3: Register the IRKernel Again#
Activate your virtual environment (if not already active):
source /Users/apollo/documents/athena/myenv/bin/activate
Ensure Jupyter is installed:
pip install jupyter jupyter-client
Open R from the terminal:
R
Run the IRKernel installation command:
IRkernel::installspec(user = TRUE)
Verify Kernel Registration#
Check available Jupyter kernels:
jupyter kernelspec list
These steps should ensure that R is accessible from the terminal and allow you to properly register the IRKernel for use in Jupyter Notebooks within VSCode.
Show code cell source
# Install necessary packages if not already installed
if (!requireNamespace("IRkernel", quietly = TRUE)) {
  install.packages("IRkernel", repos = "http://cran.us.r-project.org")
  IRkernel::installspec()
}

if (!requireNamespace("ggplot2", quietly = TRUE)) {
  install.packages("ggplot2", repos = "http://cran.us.r-project.org")
}

if (!requireNamespace("dplyr", quietly = TRUE)) {
  install.packages("dplyr", repos = "http://cran.us.r-project.org")
}

# Load libraries with suppressed messages
suppressPackageStartupMessages(library(ggplot2))
suppressPackageStartupMessages(library(dplyr))

# Print a simple message
print("Hello, Jupyter!")

# Create a simple data frame
data <- data.frame(
  x = rnorm(100),
  y = rnorm(100)
)

# Display the first few rows of the data frame
head(data)

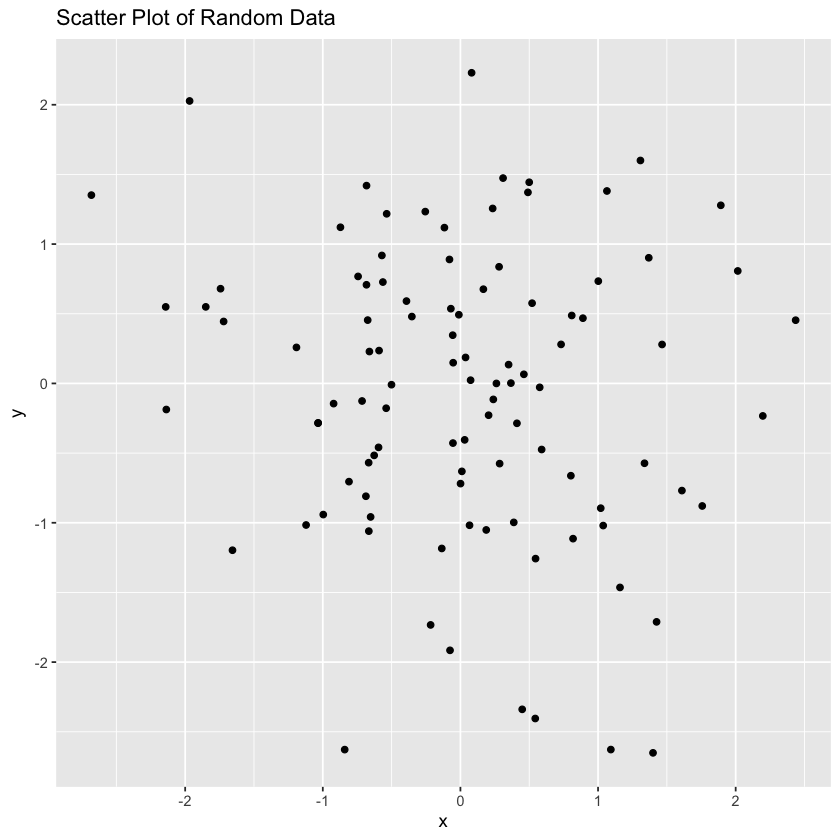
# Create a simple plot
ggplot(data, aes(x = x, y = y)) +
  geom_point() +
  ggtitle("Scatter Plot of Random Data")

# Perform a simple calculation
mean_x <- mean(data$x)
mean_y <- mean(data$y)

# Print the results
cat("Mean of x:", mean_x, "\n")
cat("Mean of y:", mean_y, "\n")
1 + 1

