System#
Here’s how to channel Mel Gibson’s primal intensity, instinctual connection, and visceral storytelling to pitch your app to Shruti Mehta and secure that two-year contract (Let’s restrain from anarchism):
Salvation in Your Hands#
Dr. Mehta, what if we could end abstraction in epidemiology? What if we could abolish the tyranny of outdated, static models that leave students and researchers tangled in intellectual webs, detached from reality? What if, instead, we could ignite instinctual understanding—put personalized risk, real-time data, and Kaplan-Meier curves in every student’s hands?
This is Salvation: a tool so intuitive it bypasses every intellectual barrier, delivering clarity directly into action. With one click, anyone—students, researchers, clinicians—can access a live platform that transforms lifesaving decisions into visual, personalized realities.
The Gut Punch#
Imagine this:
A 23-year-old considering kidney donation. They input their data, and instantly, a Kaplan-Meier curve unfolds before them—their risk versus their baseline. They see not just the outcome, but the confidence in that estimate.
Now imagine an 84-year-old doing the same. They see wide confidence intervals, reflecting the sparse data in their cohort. This isn’t just numbers—it’s meaning, contextualized, personalized, real.
The Reverse Engineering#
Let the play come after the salvation.
Students can reverse engineer this app—discover how combinatorial regression models, real-world data, and personalized risk analyses work seamlessly together to deliver instant insights. This is Gen Z’s language: mobile, visual, experiential. No more abstract hazard ratios. No more detachment. This is regression modeling in their hands.
Why Now? Why You?#
Dr. Mehta, you lead the guardians of epidemiology’s traditions, but also its evolution. This app is the bridge between old morality—traditional teaching and static models—and the new morality—experiential learning and dynamic insights.
With Salvation, your department leads the way. You don’t just teach epidemiology; you redefine it for a generation that lives on platforms, that demands to see, touch, and feel data in action.
The Ask#
Two years. Full departmental access. A partnership that puts Johns Hopkins’ Department of Epidemiology at the forefront of digital epidemiological teaching tools. Let’s make Salvation the hallmark of how Gen Z learns epidemiology—and let’s make it happen together.
The URL#
Dr. Mehta, with all due respect, there’s no time to hesitate. Click here: [Insert URL]. See Salvation for yourself. Try it. Feel the power in your hands.
This is Mel Gibson’s pitch distilled into data science: primal, visceral, immediate, and unforgettable. Time to hit play.
Show code cell source
import numpy as np
import matplotlib.pyplot as plt
import networkx as nx
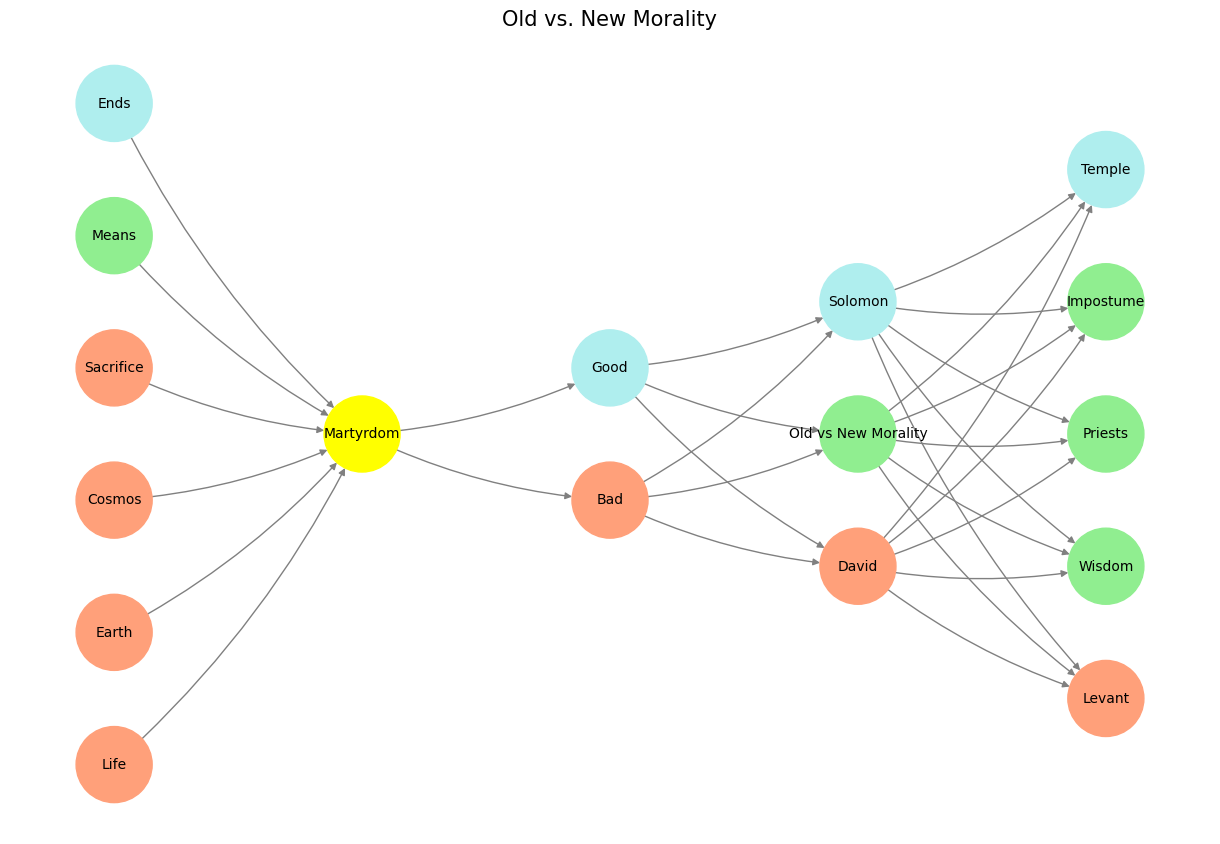
# Define the neural network structure; modified to align with "Aprés Moi, Le Déluge" (i.e. Je suis AlexNet)
def define_layers():
return {
'Pre-Input/CudAlexnet': ['Life', 'Earth', 'Cosmos', 'Sacrifice', 'Means', 'Ends'],
'Yellowstone/SensoryAI': ['Martyrdom'],
'Input/AgenticAI': ['Bad', 'Good'],
'Hidden/GenerativeAI': ['David', 'Old vs New Morality', 'Solomon'],
'Output/PhysicalAI': ['Levant', 'Wisdom', 'Priests', 'Impostume', 'Temple']
}
# Assign colors to nodes
def assign_colors(node, layer):
if node == 'Martyrdom':
return 'yellow'
if layer == 'Pre-Input/CudAlexnet' and node in [ 'Ends']:
return 'paleturquoise'
if layer == 'Pre-Input/CudAlexnet' and node in [ 'Means']:
return 'lightgreen'
elif layer == 'Input/AgenticAI' and node == 'Good':
return 'paleturquoise'
elif layer == 'Hidden/GenerativeAI':
if node == 'Solomon':
return 'paleturquoise'
elif node == 'Old vs New Morality':
return 'lightgreen'
elif node == 'David':
return 'lightsalmon'
elif layer == 'Output/PhysicalAI':
if node == 'Temple':
return 'paleturquoise'
elif node in ['Impostume', 'Priests', 'Wisdom']:
return 'lightgreen'
elif node == 'Levant':
return 'lightsalmon'
return 'lightsalmon' # Default color
# Calculate positions for nodes
def calculate_positions(layer, center_x, offset):
layer_size = len(layer)
start_y = -(layer_size - 1) / 2 # Center the layer vertically
return [(center_x + offset, start_y + i) for i in range(layer_size)]
# Create and visualize the neural network graph
def visualize_nn():
layers = define_layers()
G = nx.DiGraph()
pos = {}
node_colors = []
center_x = 0 # Align nodes horizontally
# Add nodes and assign positions
for i, (layer_name, nodes) in enumerate(layers.items()):
y_positions = calculate_positions(nodes, center_x, offset=-len(layers) + i + 1)
for node, position in zip(nodes, y_positions):
G.add_node(node, layer=layer_name)
pos[node] = position
node_colors.append(assign_colors(node, layer_name))
# Add edges (without weights)
for layer_pair in [
('Pre-Input/CudAlexnet', 'Yellowstone/SensoryAI'), ('Yellowstone/SensoryAI', 'Input/AgenticAI'), ('Input/AgenticAI', 'Hidden/GenerativeAI'), ('Hidden/GenerativeAI', 'Output/PhysicalAI')
]:
source_layer, target_layer = layer_pair
for source in layers[source_layer]:
for target in layers[target_layer]:
G.add_edge(source, target)
# Draw the graph
plt.figure(figsize=(12, 8))
nx.draw(
G, pos, with_labels=True, node_color=node_colors, edge_color='gray',
node_size=3000, font_size=10, connectionstyle="arc3,rad=0.1"
)
plt.title("Old vs. New Morality", fontsize=15)
plt.show()
# Run the visualization
visualize_nn()