
Prometheus#
Polybius stands as one of the most influential historians of the ancient world, not merely for the survival of his Histories but for the depth of his political analysis. Living in the tumultuous period of Rome’s rise to dominance, Polybius sought to provide a universal history that captured the interconnected nature of Mediterranean affairs, detailing the Punic Wars, Macedonian conflicts, and the broader transformation of the ancient geopolitical order. His work was not simply a record of events but a methodological inquiry into how Rome ascended while others faltered. His discussion of the mixed constitution—blending monarchy, aristocracy, and democracy—prefigured later political theories that informed Montesquieu and the framers of the United States Constitution. The idea that a stable government required a balance of competing forces, with checks and balances to prevent tyranny, was an insight that resonated across centuries, embedding itself within the DNA of Western political thought.

King Lear. The senile bequest motive at the outset makes it an endearing classic. but the plot gets messy. what do folks thing about it? Perhaps reality is that messy, with orthogonal plots unfolding to determine the outcome?
Yet Polybius did not operate in a vacuum. His work reflects a synthesis of Greek and Roman perspectives, drawing from the philosophical traditions of Aristotle and the pragmatic militarism of Rome. As a hostage-turned-advisor within the Roman elite, Polybius was uniquely positioned to observe the mechanisms of power from within. His close relationship with Scipio Aemilianus, the general who led the destruction of Carthage in 146 BC, allowed him firsthand access to decision-making at the highest levels. This duality—being both an outsider and an insider—enabled Polybius to craft a historical method that was comparative, analytical, and empirical. He was not content with mere narration; he sought causality, tracing patterns of rise and decline, and emphasizing the cyclic nature of political evolution.
If we consider Polybius’s framework through a modern lens, particularly within the structure of networks and dynamic systems, we see an underlying logic of interaction that mirrors contemporary models of governance, immune responses, and even artificial intelligence. His notion of anacyclosis, the cycle of political change, resonates with systems of feedback loops in computational models. In a neural network, just as in politics, no node functions in isolation—inputs are processed, weights adjusted, and outputs generated based on accumulated experience. Polybius’s Rome was an organism in evolution, continuously reweighting its structures of power to maintain stability amidst external pressures. The Roman Republic, with its Senate, Consuls, and popular assemblies, functioned not unlike an adaptive immune system—capable of responding to threats, learning from conflicts, and recalibrating its strategies.
The connections between Polybius’s analysis and computational structures extend further when we introduce the framework of OPRAH™—a model mapping immunological principles onto neural architectures. In this structure, the different layers—Suis, Voir, Choisis, Deviens, and M’élève—represent gradations of recognition, response, selection, adaptation, and emergent complexity. Polybius’s Rome, much like an immune system, maintained its supremacy by continuously learning from its environment, distinguishing friend from foe, and deploying calibrated responses. The Senate (analogous to Tregs in immunology) exercised regulatory control, preventing the system from overreacting into chaos, while the Consuls (akin to effector T-cells) led decisive actions in response to crises. The people, the broadest base of the structure, functioned as the reservoir of potential energy, akin to the adaptive lymphoid system, offering both passive consent and the possibility of revolutionary change.
Dismiss your vows, your feigned tears, your flatt’ry; For where a heart is hard they make no batt’ry.” Source: Venus & Adonis
By mapping Polybius onto the OPRAH™ network, we can explore history not as a static account of the past but as a dynamic interplay of forces operating under biological and systemic laws. Just as an immune system detects and neutralizes threats while preserving homeostasis, Rome absorbed external influences, neutralized existential threats, and adapted its internal mechanisms to survive. Its eventual transformation into an autocracy, much like immune dysregulation, suggests a failure in homeostatic balance—a failure Polybius foresaw in his analysis of anacyclosis. When regulatory mechanisms break down, unchecked expansion leads to systemic instability, a lesson equally applicable to states, organisms, and artificial intelligence.
Polybius, therefore, serves as more than a historian of antiquity; he emerges as an architect of systemic thought, an early observer of equilibrium strategies that continue to inform governance, biological models, and network structures. In his Histories, we find not just a narrative of Rome’s rise but a blueprint for understanding how complex systems function, evolve, and ultimately, collapse when their internal checks fail. Whether viewed through the lens of immunology, artificial intelligence, or political theory, Polybius remains an indispensable guide to the mechanics of survival and decline.
Show code cell source
import numpy as np
import matplotlib.pyplot as plt
import networkx as nx

# Define the neural network layers
def define_layers():
    return {
        'Tragedy (Pattern Recognition)': ['Cosmology', 'Geology', 'Biology', 'Ecology', "Symbiotology", 'Teleology'],
        'History (Non-Self Surveillance)': ['Non-Self Surveillance'],
        'Epic (Negotiated Identity)': ['Synthetic Teleology', 'Organic Fertilizer'],
        'Drama (Self vs. Non-Self)': ['Resistance Factors', 'Purchasing Behaviors', 'Knowledge Diffusion'],
        "Comedy (Resolution)": ['Policy-Reintegration', 'Reducing Import Dependency', 'Scaling EcoGreen Production', 'Gender Equality & Social Inclusion', 'Regenerative Agriculture']
    }

# Assign colors to nodes
def assign_colors():
    color_map = {
        'yellow': ['Non-Self Surveillance'],
        'paleturquoise': ['Teleology', 'Organic Fertilizer', 'Knowledge Diffusion', 'Regenerative Agriculture'],
        'lightgreen': ["Symbiotology", 'Purchasing Behaviors', 'Reducing Import Dependency', 'Gender Equality & Social Inclusion', 'Scaling EcoGreen Production'],
        'lightsalmon': ['Biology', 'Ecology', 'Synthetic Teleology', 'Resistance Factors', 'Policy-Reintegration'],
    }
    return {node: color for color, nodes in color_map.items() for node in nodes}

# Define edges
def define_edges():
    return [
        ('Cosmology', 'Non-Self Surveillance'),
        ('Geology', 'Non-Self Surveillance'),
        ('Biology', 'Non-Self Surveillance'),
        ('Ecology', 'Non-Self Surveillance'),
        ("Symbiotology", 'Non-Self Surveillance'),
        ('Teleology', 'Non-Self Surveillance'),
        ('Non-Self Surveillance', 'Synthetic Teleology'),
        ('Non-Self Surveillance', 'Organic Fertilizer'),
        ('Synthetic Teleology', 'Resistance Factors'),
        ('Synthetic Teleology', 'Purchasing Behaviors'),
        ('Synthetic Teleology', 'Knowledge Diffusion'),
        ('Organic Fertilizer', 'Resistance Factors'),
        ('Organic Fertilizer', 'Purchasing Behaviors'),
        ('Organic Fertilizer', 'Knowledge Diffusion'),
        ('Resistance Factors', 'Policy-Reintegration'),
        ('Resistance Factors', 'Reducing Import Dependency'),
        ('Resistance Factors', 'Scaling EcoGreen Production'),
        ('Resistance Factors', 'Gender Equality & Social Inclusion'),
        ('Resistance Factors', 'Regenerative Agriculture'),
        ('Purchasing Behaviors', 'Policy-Reintegration'),
        ('Purchasing Behaviors', 'Reducing Import Dependency'),
        ('Purchasing Behaviors', 'Scaling EcoGreen Production'),
        ('Purchasing Behaviors', 'Gender Equality & Social Inclusion'),
        ('Purchasing Behaviors', 'Regenerative Agriculture'),
        ('Knowledge Diffusion', 'Policy-Reintegration'),
        ('Knowledge Diffusion', 'Reducing Import Dependency'),
        ('Knowledge Diffusion', 'Scaling EcoGreen Production'),
        ('Knowledge Diffusion', 'Gender Equality & Social Inclusion'),
        ('Knowledge Diffusion', 'Regenerative Agriculture')
    ]

# Define black edges (1 → 7 → 9 → 11 → [13-17])
black_edges = [
    (4, 7), (7, 9), (9, 11), (11, 13), (11, 14), (11, 15), (11, 16), (11, 17)
]

# Calculate node positions
def calculate_positions(layer, x_offset):
    y_positions = np.linspace(-len(layer) / 2, len(layer) / 2, len(layer))
    return [(x_offset, y) for y in y_positions]

# Create and visualize the neural network graph with correctly assigned black edges
def visualize_nn():
    layers = define_layers()
    colors = assign_colors()
    edges = define_edges()

    G = nx.DiGraph()
    pos = {}
    node_colors = []

    # Create mapping from original node names to numbered labels
    mapping = {}
    counter = 1
    for layer in layers.values():
        for node in layer:
            mapping[node] = f"{counter}. {node}"
            counter += 1

    # Add nodes with new numbered labels and assign positions
    for i, (layer_name, nodes) in enumerate(layers.items()):
        positions = calculate_positions(nodes, x_offset=i * 2)
        for node, position in zip(nodes, positions):
            new_node = mapping[node]
            G.add_node(new_node, layer=layer_name)
            pos[new_node] = position
            node_colors.append(colors.get(node, 'lightgray'))

    # Add edges with updated node labels
    edge_colors = {}
    for source, target in edges:
        if source in mapping and target in mapping:
            new_source = mapping[source]
            new_target = mapping[target]
            G.add_edge(new_source, new_target)
            edge_colors[(new_source, new_target)] = 'lightgrey'

    # Define and add black edges manually with correct node names
    numbered_nodes = list(mapping.values())
    black_edge_list = [
        (numbered_nodes[3], numbered_nodes[6]),  # 4 -> 7
        (numbered_nodes[6], numbered_nodes[8]),  # 7 -> 9
        (numbered_nodes[8], numbered_nodes[10]), # 9 -> 11
        (numbered_nodes[10], numbered_nodes[12]), # 11 -> 13
        (numbered_nodes[10], numbered_nodes[13]), # 11 -> 14
        (numbered_nodes[10], numbered_nodes[14]), # 11 -> 15
        (numbered_nodes[10], numbered_nodes[15]), # 11 -> 16
        (numbered_nodes[10], numbered_nodes[16])  # 11 -> 17
    ]

    for src, tgt in black_edge_list:
        G.add_edge(src, tgt)
        edge_colors[(src, tgt)] = 'black'

    # Draw the graph
    plt.figure(figsize=(12, 8))
    nx.draw(
        G, pos, with_labels=True, node_color=node_colors,
        edge_color=[edge_colors.get(edge, 'lightgrey') for edge in G.edges],
        node_size=3000, font_size=9, connectionstyle="arc3,rad=0.2"
    )

    plt.title("EcoGreen: Reclaiming Agricultural Self", fontsize=18)
    plt.show()

# Run the visualization
visualize_nn()
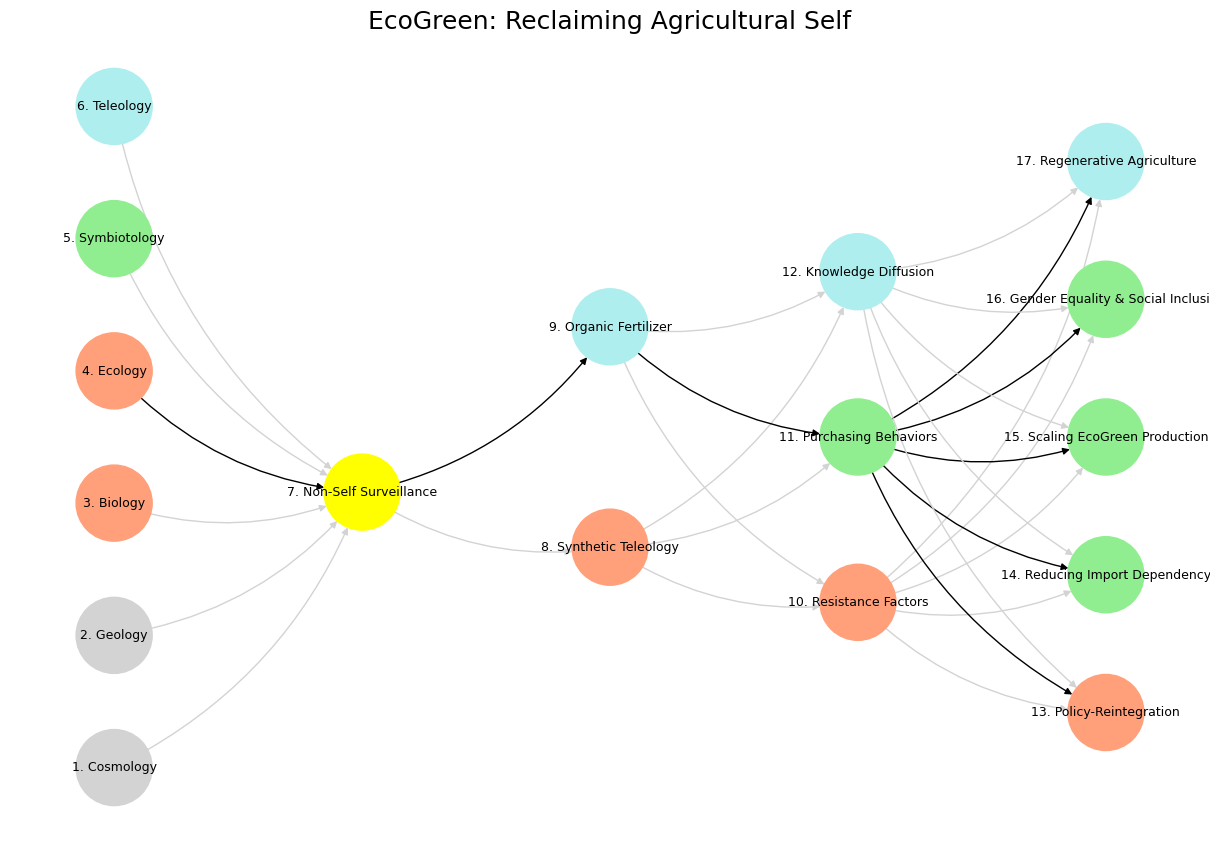

Fig. 7 The TPN, driving goal-directed action, aligns with the transcriptome and proteome—layers that translate data into response. Here, Bacon’s empirical method shines: knowledge arises from doing, from testing the world. In the “Nonself & the Salient Network” variant, CD4+ and CD8+ T-cells activate cytokines like TNF-α, embodying the TPN’s focus on immediate threats—Nonself invaders—over reflective stasis. Nietzsche’s critical history fits this mode: a selective, pragmatic engagement with the past to propel life forward. The Salient Node, bridging DMN and TPN, mirrors the metabolome and regulatory mechanisms like Tregs—arbiters of relevance amid noise. Aristotle’s phronesis, practical wisdom, governs here: neither lost in ideals nor blinded by action, but balancing both. The “Distributed Network” variant highlights Tregs modulating downstream systems—Complement, Platelets—preserving “Self” while adapting to “Nonself.” This is Nietzsche’s history at its best: a dynamic synthesis serving life’s needs. Wisdom emerges as the Salient Node’s domain, integrating DMN’s depth and TPN’s drive, much as Aristotle tempers Plato’s abstraction with Bacon’s observation. Intelligence, raw and unrefined, resides in the lower layers—data-rich but directionless. The immune system’s Mismatch Repair, correcting errors of “Self,” parallels this: a wise curation of history, biological or neural, against the noise of entropy. Nietzsche’s vision finds fruition here—not in history’s abuses, but its uses: a life-affirming dance of preservation and transformation, coded in networks both flesh and mind.#
Let’s expand this for your graduate students. Think of it as a bridge from their comfort zone (Stata scripts and epidemiologic rigor) to the expressive, self-published world of narrative data science. We’ll treat Jupyter Book and MyST Markdown as a toolkit not just for code, but for storytelling in their own voice—messy, urgent, generational. Here’s the fleshed-out version:
From Stata Scripts to Shakespearean Structure:#
A Gen Z Introduction to MyST Markdown in Jupyter Book#
You’ve already mastered the sturdy precision of Stata—cross-tabulations, regressions, and those glorious esttab tables that whisper confidence into academic prose. But we’re now entering an era where even statistical narratives must sing. Welcome to the self-publishing ethos of your generation—where reproducible research meets visual storytelling, GitHub becomes your press, and Jupyter Book is the stage.
At first glance, Jupyter Book looks like just another tool for notebooks. But dig deeper and you’ll see it’s something richer: a platform that lets you choreograph code, commentary, and chaos with deliberate structure. Think of it as Shakespeare’s Globe, restaged on GitHub—where {}-enclosed directives don’t just format your text, they create epistemic rhythm. Here’s how to wield these tools with the flair of Lear’s Fool and the cunning of Cordelia.
📸 Figure Directives: Let the Images Speak in Metaphor#
In MyST, you embed figures using a figure directive. The syntax is clean, but the results can be dramatic—especially when you learn to use images not just to illustrate but to allude. Consider the image below of the Red Queen—an evolutionary allegory and a chaotic matriarch—who happens to mirror both King Lear and the late-stage political descendants of Trump:
Notice the caption isn’t a literal description. It’s a critique. A wink. Use this space to encode irony, tension, or even memes. The generation raised on TikTok cuts through polish. Give them interpretive wiggle room.
⚠️ Admonition Directives: Callout Boxes with Attitude#
Admonitions are the backbone of MyST’s literary flexibility. They’re stylized callouts—note, tip, danger, warning, and more—that can carry tone, snark, or solemnity. These are perfect for students who want to editorialize their models or express discontent with historical narratives, institutional failure, or—in this case—public figures who flirted with fascism.
Note
It’s chaotic and wouldn’t have merit if Shakespeare hadn’t mastered tidier tales like Hamlet—his cred earns Lear’s sprawl.
Tip
Don’t miss Vance’s Never Trumper phase—his flattery spiked from 0 to 11 post-Thiel’s whisper.
Important
Trump at 78 bequeaths MAGA to a Hillbilly Elegy heir—Lear’s delusion drives the parallel.
These aren’t just formatting tools. They’re affective devices. They encode judgment, style, and even sarcasm. If Stata is your scalpel, MyST’s admonitions are your palette.
And yes, you can stack them:
Warning
Excessive flattery risks alienating the hillbillies Vance once mourned—scores above 12 signal a storm.
Danger
Vance’s pivot to praising Trump as a “generational leader” could make him Goneril, not Edgar—flattery at 15 is perilous.
Make room for ambiguity. The best of Shakespeare, and the worst of our political era, thrive on it.
💻 Code Blocks: Still Data, Still Righteous#
Even in this age of theater and markdown aesthetics, the backbone is code. Your flattery-o-meter, for instance, can be built with Python like so:
print("Flattery score: Trump = ∞, Vance = 11")
Or more dynamically:
This is where you bridge your hard-won statistical chops with new stylistic freedoms. Your narrative and your numbers matter. This is not either/or. It’s Gen Z’s version of Renaissance man: post-method, post-truth, but never post-critique.
🌪️ Raw HTML: Embed Anything. Even the Storm Itself#
Want to drop in a YouTube video, tweet, or simulation? The {raw} html block opens the gates to unfiltered web content. This is how you channel chaos with structure—like Lear’s storm scene, or Vance’s televised conversions.
Now your work is no longer static. It breathes. It storms. It whispers in hyperlinks and sings in iframes.
🛠️ Putting It All Together: The New Academic Publishing#
This isn’t just technical training. It’s a moral and aesthetic pivot. The flattery-o-meter metaphor isn’t a joke—it’s a method. You’re learning to read power, language, and legacy like a critic, a coder, and a citizen. When your .md or .ipynb file renders, it shouldn’t just report results. It should stage a reckoning.
Here’s the process:
Copy the Blocks
Select, copy (Ctrl+CorCmd+C), and paste them into your Jupyter Notebook or Markdown file.Run in
.ipynb
Add a Markdown cell, paste, and run. For full rendering (especially of admonitions), installmyst-nband run%load_ext myst_nb.Use in Jupyter Book
Save your file aschapter.md, build your book withjupyter-book build ., and behold: a narrative, code-rich, chaos-informed chapter worthy of publication.
🎓 Final Thought#
You are not just analysts. You are authors of your generation’s truth-telling. And truth—filtered through Markdown, staged through figures, and annotated with warning, danger, and wit—is the new praxis.
Shakespeare wrote during plague lockdowns. You learned Stata during COVID. Now, in this aftermath, write not just what you know—but how you see.
Your generation doesn’t flatter the king. You remix his storm.