
Apollo & Dionysus#
Hellenism#
The Greeks, the Cosmos, and Theomachy#
The Greeks were unparalleled in their ability to distill the complexities of the cosmos into narratives that resonate across millennia. Their mythologies, particularly Theomachy—the divine battles among gods—are not mere tales of conflict but profound metaphors for the cyclical, iterative nature of existence. Stars form and die, the universe expands and contracts, and ecosystems arise and dissolve, all echoing the relentless cosmic rhythm the Greeks captured so vividly in their myths. Before Einstein formalized relativity or thermodynamics illuminated entropy, the Greeks peered into the abyss of existence and gave it faces: Chaos, Gaea, Uranus, and Cronus, each representing forces far beyond human comprehension yet intricately connected to life on Earth.
The Greeks’ understanding of primal forces as gods—Chaos as the abyss, Gaea as the earth, and Titans as embodiments of raw, untamed power—is strikingly similar to how modern science views the universe’s fundamental building blocks. Chaos mirrors entropy, the formless state from which order (and ultimately disorder) emerges. Gaea, the earth mother, aligns with the delicate balance of planetary temperance, a precondition for life. The Titans, with their ferocity and boundless energy, reflect the violent forces of creation that forged the cosmos and later, by extension, the fire Prometheus gave humanity.
Prometheus, perhaps the most fascinating figure in this pantheon, embodies the generative processes that define humanity. Fire, his ultimate gift, transcends the literal flame. It is technology, creativity, and the means by which humanity has transformed its environment. The Greeks, through Prometheus, acknowledged that life itself is driven by iterative acts of creation and destruction, each a step toward greater complexity. Fire, in their understanding, catalyzes the ecosystem of generative means that humankind uses to shape its world, often at great cost—a theme that feels prophetic in light of our modern environmental crises.

Fig. 15 Trump—Flanked By Larry Ellison, Sam Altman, & Masayoshi Son—Announces Project Stargate. President Trump, flanked by top tech executives and AI experts, announces a major new AI initiative called Project Stargate. Our App provides infrastructure that connects this to the academic medicines workflows#
Theomachy as Iteration#
Theomachy is a remarkable metaphor for the iterative process of existence. The gods’ battles reflect the constant interplay of forces—destruction leading to creation and vice versa. This cycle is as evident in the cosmos as it is in human endeavors. Stars die in supernovae, scattering elements that form new stars and planets. This cosmic iteration mirrors the struggles among the gods, where victory and loss are transient, and the equilibrium of power is ever-shifting. The immortals do not die in the Greek tradition, yet they evolve, adapting to the outcomes of their conflicts. This parallels the Red Queen hypothesis in biology: survival demands continuous adaptation, a perpetual arms race against entropy.
The Greeks also understood the costs of this iteration. Prometheus’s punishment for defying Zeus and giving fire to humanity is emblematic of the sacrifices inherent in progress. For every leap forward, there is a price to be paid, whether it is Prometheus bound to a rock or ecosystems bearing the weight of human innovation. Theomachy, then, is not only a divine struggle but also a mirror of the human condition: an eternal negotiation between generative means and the costs they incur.
Neural Networks and the Greek Cosmos#
Modern neural networks offer a compelling analogy to the Greek cosmos. In the visualization of the network you provided, layers of nodes represent iterative processes of perception, agency, and generativity, much like the layers of Greek mythology. At the top is the cosmos—entropy and the generative forces of creation. Below, the ecosystem and human life, shaped by perception and agency, emerge as outputs of these primal forces.
The neural network’s hidden layers—the dynamic processes of competition, cooperation, and monopolization—echo the struggles of Theomachy. These layers encode the iterative compromises and conflicts that define both divine and human realms. The generative nodes, where ratio is weaponized and competition tokenized, align with Prometheus’s fire: the technologies and tools that humanity wields to reshape its destiny, often at the risk of monopolization and exploitation.
The Greeks, like this neural network, compressed vast cosmic truths into a comprehensible framework. Their myths are nodes in a network of meaning, where each god, titan, and mortal represents a distinct yet interconnected force. Theomachy, at its heart, is a visualization of the cosmos—a network of eternal iteration, where every conflict feeds into the generative processes of life and creation.
A Marvelous Compression of Insight#
It is truly astonishing that the Greeks, without the benefit of modern science, captured the essence of cosmology and entropy. Their mythological framework compresses the vast, incomprehensible forces of the universe into narratives that remain intelligible and profound. Theomachy is not merely a tale of divine battles but a model of iteration, transformation, and the eternal dance of creation and destruction.
Prometheus’s fire symbolizes the generative means by which humanity transforms the cosmos into a habitable world, reflecting the interplay between life and its ecosystem. The costs of this process, seen in both mythology and modern environmental concerns, remind us that progress is never without sacrifice.
The Greeks gazed into the stars and saw not chaos but a network of meaning—a cosmos of interconnected forces, much like the layers of a neural network. Their ability to articulate these truths, to encode the essence of existence in myth, is nothing short of a marvel. Through their stories, they invite us to see the universe as they did: a dynamic, iterative process of becoming, where every end is a new beginning.
La La Land#
Chapter: Down the Rabbit Hole – Alice in Epidemiological Wonderland#
“But I don’t want to go among mad people,” Alice remarked.
“Oh, you can’t help that,” said the Cat. “We’re all mad here.”
Alice stood at the entrance of the rabbit hole, a curious figure in a perplexing world of probabilities and perioperative mortality. Above her, a signpost read:
“Journal of American Medical Association, September 2024: Three-Year Trends in Perioperative Mortality Following Living Kidney Donation.”
The signpost was austere, almost uninviting, but for those who dared to venture further, it promised an adventure through the abstract and into the bewildering terrain of personalized risk, dynamic images, and the inner workings of an open scientific ecosystem. With a deep breath, Alice stepped into the hole, tumbling not into darkness but into a kaleidoscopic wonderland of data, logic, and innovation.
Static Versus Dynamic: The First Encounter#
At first, Alice found herself staring at a static Kaplan-Meier curve. The graph was elegant in its simplicity—90-day mortality among living kidney donors, each dot on the curve a life reduced to data. But the curve was frozen, unyielding. Alice tilted her head and thought: “This is useful for someone, but not for me—not for me. I’m not 50 years old, male, and perfectly average in every way.”
From the shadows appeared a figure, the Cheshire Cat, grinning. “You see, Alice, static images are like the Queen of Hearts: absolute but blind. What if this image could bend to fit you? What if we could input your age, BMI, blood pressure, and serum creatinine? What if the curve wasn’t fixed but could move, dance, and reflect your reality?”
Alice gasped. “Can it?” she asked.
“Oh, it can,” said the Cat, fading but leaving behind the whisper of “dynamic images on GitHub Pages.”
Through the Looking Glass of Personalized Risk#
Alice followed the Cheshire Cat’s trail and arrived at a mirror that reflected not her image, but a graph:
On one side, the risk curve if she chose to donate her kidney.
On the other, the counterfactual—a curve if she kept her two kidneys intact.
Overlayed, the two graphs shimmered in tandem. The difference between them? Attributable risk, a delicate balance of uncertainty, with error bars that seemed to shift and quiver depending on her profile.
“This is extraordinary,” said Alice. “It’s not just about a risk; it’s about my risk. But…how do I know if the uncertainty is real?”
“Ah,” came the voice of the Cheshire Cat. “That depends on your age and data density. You, Alice, are like a 30-year-old donor; the precision of your risk is high. But imagine an 85-year-old donor—we’d have far less data. The standard error would be wider, the confidence lower. This is the art of personalized uncertainty.”
Alice nodded thoughtfully. “So, this isn’t just science; it’s empathy in numbers.”
Counterfactuals and Homicides: The Mad Hatter’s Tea Party#
Alice soon stumbled upon a peculiar tea party. At the head of the table sat the Mad Hatter, stirring tea with one hand while pointing at a letter to the editor with the other.
“This,” he exclaimed, “is the part they always forget! In this letter, they mention that a healthy person has risk even without surgery. Someone could walk out of the hospital and meet a homicidal maniac! Perioperative mortality isn’t just about surgery—it’s about life itself!”
Alice stared at him, bewildered. “You mean we need a control group?”
“Precisely!” said the Hatter. “And we must visualize it dynamically. Overlaid graphs: one for donors, one for non-donors. Let the difference sing the song of attributable risk.”
“And the error bars?” Alice asked.
“They must dance alongside the curves, of course,” the Hatter replied. “Without them, we’re blind to uncertainty.”
GitHub Pages: The White Rabbit’s Escape Route#
The White Rabbit appeared, clutching a laptop. “GitHub Pages!” he cried. “This is how we break free from static publishing. Forget the Queen’s rigid journals—here, Alice, is a world of open science, dynamic images, and collaboration.”
Alice peered over his shoulder and saw repositories filled with .CSV files, Kaplan-Meier survival data, and variance-covariance matrices.
“What’s this?” she asked.
“This,” said the Rabbit, “is the backend of Wonderland. The matrices hold no patient identifiers, only de-identified numbers. They’re risk-free and open to the world. Professors, students, patients—anyone can access, contribute, and learn.”
Ecosystem Integration: Building the Red Queen’s Network#
Alice journeyed further and found herself in a room of endless doors. Each door bore a label: Python, AI, R, Stata, JavaScript, HTML, Jupyter Books.
“This,” said a voice behind her, “is the ecosystem of integration.” Alice turned to see the Red Queen herself, regal and imposing.
“Here, Alice, you learn not just about data but about the world that creates it. You must navigate IRBs, curate datasets, and structure survival analyses. You must understand how electronic patient records feed into multivariable regressions. And when you emerge, you will wield not just knowledge but the power to create, to innovate, and to change the way we see risk itself.”
The Graduation: Returning from Wonderland#
At last, Alice stood before an audience—a jury of peers, patients, and professors. They were the same anxious crowd that had rushed her into Wonderland, demanding clarity, precision, and answers.
She presented her thesis: a dynamic visualization of perioperative mortality risks, personalized to every individual who dared to look. She showed how GitHub Pages had revolutionized collaboration, how open science had democratized knowledge, and how counterfactuals had illuminated the unseen.
And when the applause came, it was not just for the knowledge Alice had gained but for the journey she had taken—and for the rabbit hole that had led her there.
Suggestions for Enhancements:
Dynamic Graphs: Embed a code snippet for creating interactive Kaplan-Meier curves using Python (e.g., Plotly).
Images: Include a visualization of overlapping risk curves for donors and non-donors.
Video: Link to a YouTube tutorial on personalized risk visualization in healthcare.
GitHub Repository: Provide a link to an open repository with de-identified .CSV files and analysis scripts.
This chapter captures the journey of discovery, blending science, imagination, and practical tools, ensuring that every reader becomes Alice, ready to tumble down their own rabbit hole.
Show code cell source
import numpy as np
import matplotlib.pyplot as plt
import networkx as nx

# Define the neural network fractal
def define_layers():
    return {
        'World': ['Cosmos-Entropy', 'Planet-Tempered', 'Life-Needs', 'Ecosystem-Costs', 'Generative-Means', 'Cartel-Ends', ], # Polytheism, Olympus, Kingdom
        'Perception': ['Perception-Ledger'], # God, Judgement Day, Key
        'Agency': ['Open-Nomiddleman', 'Closed-Trusted'], # Evil & Good
        'Generative': ['Ratio-Weaponized', 'Competition-Tokenized', 'Odds-Monopolized'], # Dynamics, Compromises
        'Physical': ['Volatile-Revolutionary', 'Unveiled-Resentment',  'Freedom-Dance in Chains', 'Exuberant-Jubilee', 'Stable-Conservative'] # Values
    }

# Assign colors to nodes
def assign_colors():
    color_map = {
        'yellow': ['Perception-Ledger'],
        'paleturquoise': ['Cartel-Ends', 'Closed-Trusted', 'Odds-Monopolized', 'Stable-Conservative'],
        'lightgreen': ['Generative-Means', 'Competition-Tokenized', 'Exuberant-Jubilee', 'Freedom-Dance in Chains', 'Unveiled-Resentment'],
        'lightsalmon': [
            'Life-Needs', 'Ecosystem-Costs', 'Open-Nomiddleman', # Ecosystem = Red Queen = Prometheus = Sacrifice
            'Ratio-Weaponized', 'Volatile-Revolutionary'
        ],
    }
    return {node: color for color, nodes in color_map.items() for node in nodes}

# Calculate positions for nodes
def calculate_positions(layer, x_offset):
    y_positions = np.linspace(-len(layer) / 2, len(layer) / 2, len(layer))
    return [(x_offset, y) for y in y_positions]

# Create and visualize the neural network graph
def visualize_nn():
    layers = define_layers()
    colors = assign_colors()
    G = nx.DiGraph()
    pos = {}
    node_colors = []

    # Add nodes and assign positions
    for i, (layer_name, nodes) in enumerate(layers.items()):
        positions = calculate_positions(nodes, x_offset=i * 2)
        for node, position in zip(nodes, positions):
            G.add_node(node, layer=layer_name)
            pos[node] = position
            node_colors.append(colors.get(node, 'lightgray'))  # Default color fallback

    # Add edges (automated for consecutive layers)
    layer_names = list(layers.keys())
    for i in range(len(layer_names) - 1):
        source_layer, target_layer = layer_names[i], layer_names[i + 1]
        for source in layers[source_layer]:
            for target in layers[target_layer]:
                G.add_edge(source, target)

    # Draw the graph
    plt.figure(figsize=(12, 8))
    nx.draw(
        G, pos, with_labels=True, node_color=node_colors, edge_color='gray',
        node_size=3000, font_size=9, connectionstyle="arc3,rad=0.2"
    )
    plt.title("Inversion as Transformation", fontsize=15)
    plt.show()

# Run the visualization
visualize_nn()
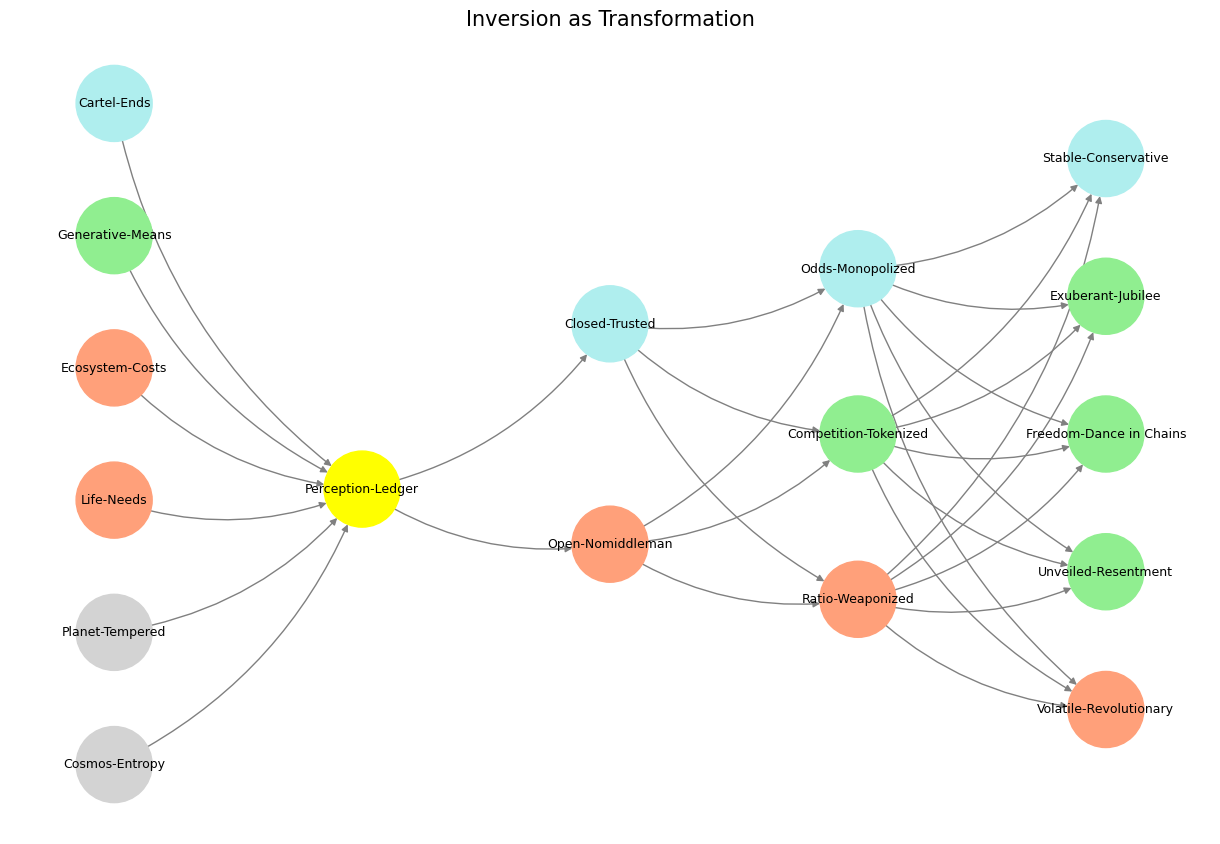
Fig. 16 Change of Guards. In Grand Illusion, Renoir was dealing the final blow to the Ancién Régime. And in Rules of the Game, he was hinting at another change of guards, from agentic mankind to one in a mutualistic bind with machines (unsupervised pianos & supervised airplanes). How priscient!#