Brasil#
Everybody has got blood 🩸 on their hands - Bourdain
                             1. f(t)
                                    \
                         2. S(t) -> 4. y:h'(t)=0;t(X'X).X'Y -> 5.b -> 6. SV'
                                    /
                                    3. h(t)

Dancing in Chains. In the case of every Greek artist, poet, or writer we must ask: What is the new constraint which he imposes upon himself and makes attractive to his contemporaries, so as to find imitators? For the thing called “invention” (in metre, for example) is always a self-imposed fetter of this kind. “Dancing in chains”—to make that hard for themselves and then to spread a false notion that it is easy—that is the trick that they wish to show us. Even in Homer we may perceive a wealth of inherited formulæ and laws of epic narration, within the circle of which he had to dance, and he himself created new conventions for them that came after. This was the discipline of the Greek poets: first to impose upon themselves a manifold constraint by means of the earlier poets; then to invent in addition a new constraint, to impose it upon themselves and cheerfully to overcome it, so that constraint and victory are perceived and admired. 1#
\(\mu\), Timing#
\(\sigma\), Qualities#
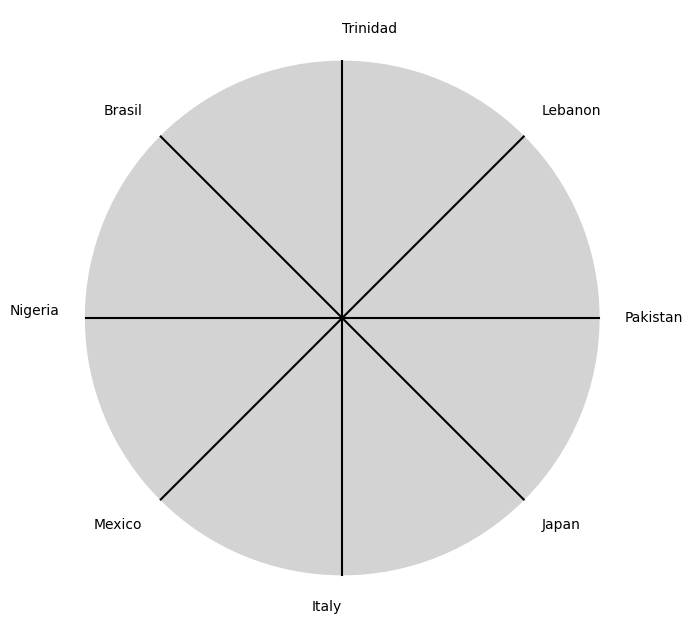
\((X'X)^T \cdot X'Y\) Nations (Worldcup)
Show code cell source
import matplotlib.pyplot as plt
import numpy as np

# Clock settings; f(t) random disturbances making "paradise lost"
clock_face_radius = 1.0
number_of_ticks = 8
tick_labels = [
    "Japan", "Italy", "Mexico", "Nigeria",
    "Brasil", "Trinidad", "Lebanon", "Pakistan"
]

# Calculate the angles for each tick (in radians)
angles = np.linspace(0, 2 * np.pi, number_of_ticks, endpoint=False)
# Inverting the order to make it counterclockwise
angles = angles[::-1]

# Create figure and axis
fig, ax = plt.subplots(figsize=(8, 8))
ax.set_xlim(-1.2, 1.2)
ax.set_ylim(-1.2, 1.2)
ax.set_aspect('equal')

# Draw the clock face
clock_face = plt.Circle((0, 0), clock_face_radius, color='lightgrey', fill=True)
ax.add_patch(clock_face)

# Draw the ticks and labels
for angle, label in zip(angles, tick_labels):
    x = clock_face_radius * np.cos(angle)
    y = clock_face_radius * np.sin(angle)

    # Draw the tick
    ax.plot([0, x], [0, y], color='black')

    # Positioning the labels slightly outside the clock face
    label_x = 1.1 * clock_face_radius * np.cos(angle)
    label_y = 1.1 * clock_face_radius * np.sin(angle)

    # Adjusting label alignment based on its position
    ha = 'center'
    va = 'center'
    if np.cos(angle) > 0:
        ha = 'left'
    elif np.cos(angle) < 0:
        ha = 'right'
    if np.sin(angle) > 0:
        va = 'bottom'
    elif np.sin(angle) < 0:
        va = 'top'

    ax.text(label_x, label_y, label, horizontalalignment=ha, verticalalignment=va, fontsize=10)

# Remove axes
ax.axis('off')

# Show the plot
plt.show()
Show code cell output

\(\%\), Delivery#
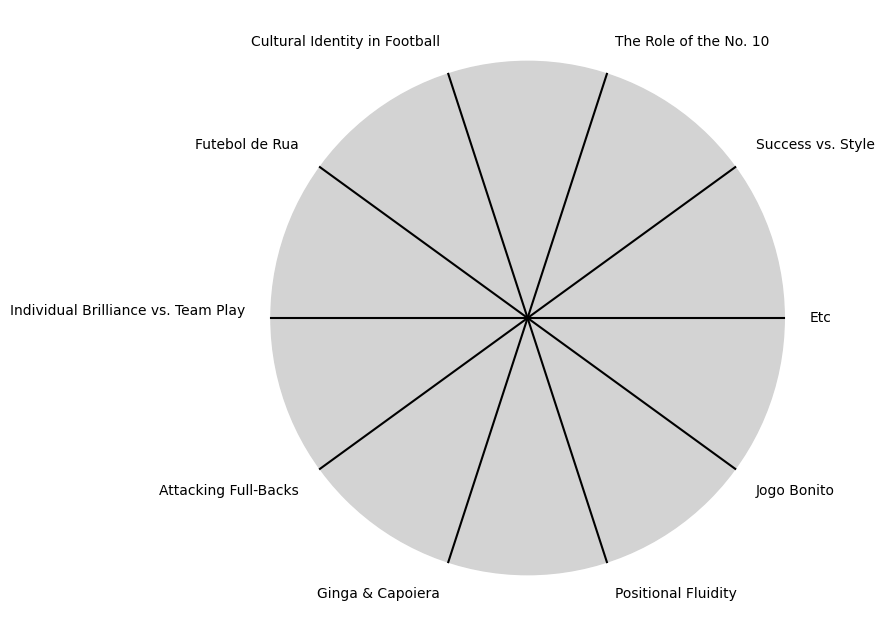
\(\beta\) Courses (Ambiguities)
Show code cell source
import matplotlib.pyplot as plt
import numpy as np

# Clock settings; f(t) random disturbances making "paradise lost"
clock_face_radius = 1.0
number_of_ticks = 10
tick_labels = [
    "Jogo Bonito", "Positional Fluidity", "Ginga & Capoiera", "Attacking Full-Backs",
    "Individual Brilliance vs. Team Play", "Futebol de Rua", "Cultural Identity in Football", "The Role of the No. 10",
    "Success vs. Style", "Etc"
]

# Calculate the angles for each tick (in radians)
angles = np.linspace(0, 2 * np.pi, number_of_ticks, endpoint=False)
# Inverting the order to make it counterclockwise
angles = angles[::-1]

# Create figure and axis
fig, ax = plt.subplots(figsize=(8, 8))
ax.set_xlim(-1.2, 1.2)
ax.set_ylim(-1.2, 1.2)
ax.set_aspect('equal')

# Draw the clock face
clock_face = plt.Circle((0, 0), clock_face_radius, color='lightgrey', fill=True)
ax.add_patch(clock_face)

# Draw the ticks and labels
for angle, label in zip(angles, tick_labels):
    x = clock_face_radius * np.cos(angle)
    y = clock_face_radius * np.sin(angle)

    # Draw the tick
    ax.plot([0, x], [0, y], color='black')

    # Positioning the labels slightly outside the clock face
    label_x = 1.1 * clock_face_radius * np.cos(angle)
    label_y = 1.1 * clock_face_radius * np.sin(angle)

    # Adjusting label alignment based on its position
    ha = 'center'
    va = 'center'
    if np.cos(angle) > 0:
        ha = 'left'
    elif np.cos(angle) < 0:
        ha = 'right'
    if np.sin(angle) > 0:
        va = 'bottom'
    elif np.sin(angle) < 0:
        va = 'top'

    ax.text(label_x, label_y, label, horizontalalignment=ha, verticalalignment=va, fontsize=10)

# Remove axes
ax.axis('off')

# Show the plot
plt.show()
Show code cell output

\(SV'\) Blood 🩸 (Pleasing)

