import numpy as np
import matplotlib.pyplot as plt
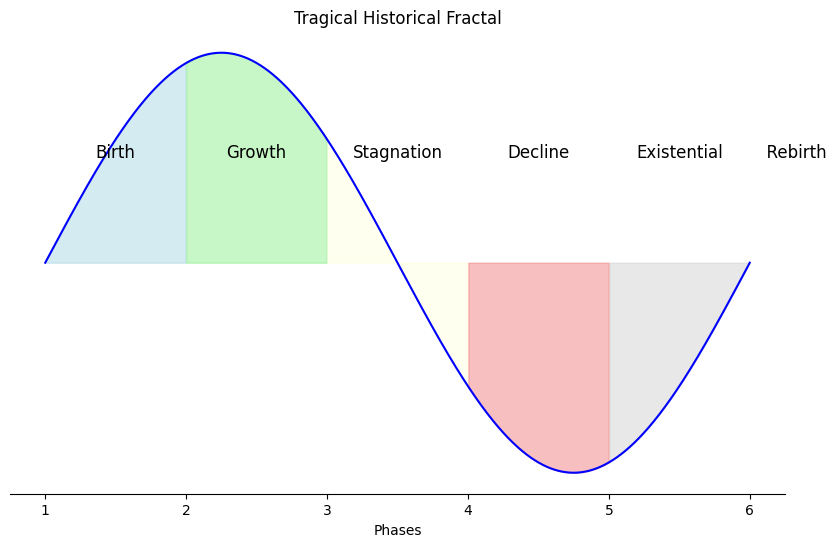
# Create x values representing the six stages, and create y values using a sine function
x = np.linspace(0, 2 * np.pi, 1000)
y = np.sin(x)
# Define the stages
stages = ["Birth", "Growth", "Stagnation", "Decline", "Existential", "Rebirth"]
# Define the x-ticks for the labeled points
x_ticks = np.linspace(0, 2 * np.pi, 6)
# Set up the plot
plt.figure(figsize=(10, 6))
# Plot the sine wave
plt.plot(x, y, color='blue')
# Fill the areas under the curve for each stage and label directly on the graph
plt.fill_between(x, y, where=(x < x_ticks[1]), color='lightblue', alpha=0.5)
plt.text(x_ticks[0] + (x_ticks[1] - x_ticks[0]) / 2, 0.5, "Birth", fontsize=12, ha='center')
plt.fill_between(x, y, where=(x_ticks[1] <= x) & (x < x_ticks[2]), color='lightgreen', alpha=0.5)
plt.text(x_ticks[1] + (x_ticks[2] - x_ticks[1]) / 2, 0.5, "Growth", fontsize=12, ha='center')
plt.fill_between(x, y, where=(x_ticks[2] <= x) & (x < x_ticks[3]), color='lightyellow', alpha=0.5)
plt.text(x_ticks[2] + (x_ticks[3] - x_ticks[2]) / 2, 0.5, "Stagnation", fontsize=12, ha='center')
plt.fill_between(x, y, where=(x_ticks[3] <= x) & (x < x_ticks[4]), color='lightcoral', alpha=0.5)
plt.text(x_ticks[3] + (x_ticks[4] - x_ticks[3]) / 2, 0.5, "Decline", fontsize=12, ha='center')
plt.fill_between(x, y, where=(x_ticks[4] <= x) & (x < x_ticks[5]), color='lightgray', alpha=0.5)
plt.text(x_ticks[4] + (x_ticks[5] - x_ticks[4]) / 2, 0.5, "Existential", fontsize=12, ha='center')
plt.fill_between(x, y, where=(x_ticks[5] <= x), color='lightpink', alpha=0.5)
plt.text(x_ticks[5] + (2 * np.pi - x_ticks[5]) / 2, 0.5, " Rebirth", fontsize=12, ha='center')
# Set x-ticks and labels
plt.xticks(x_ticks, ["1", "2", "3", "4", "5", "6"])
# Label x axis
plt.xlabel("Phases")
# Remove y-axis, top, and right borders
plt.gca().spines['top'].set_visible(False)
plt.gca().spines['right'].set_visible(False)
plt.gca().spines['left'].set_visible(False)
plt.gca().get_yaxis().set_visible(False)
# Title
plt.title("Tragical Historical Fractal")
# Show the plot
plt.savefig('../figures/logo.png', bbox_inches='tight', transparent=True)
plt.show()