Gastro#
                             1. f(t)
                                    \
                         2. S(t) -> 4. y:h'(t)=0;t(X'X).X'Y -> 5.b -> 6. SV'
                                    /
                                    3. h(t)

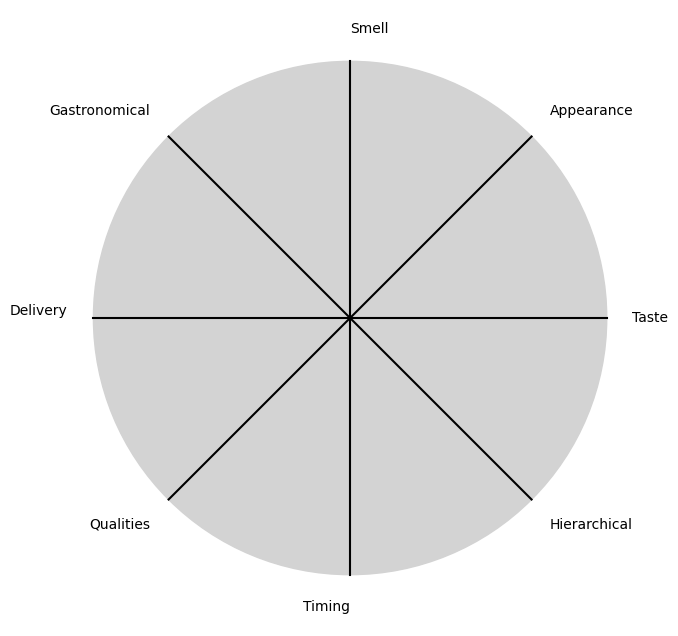
Hittting the spot. From molecules to gastronomy, flavors, cuisines, tribes, experience#
\(\mu\), Timing#
\(f(t)\) Molecules
\(S(t)\) Gastronomical traditions
\(h(t)\) Flavors & emotional resonance with old memories or ideals
\(\sigma\), Qualities#
\((X'X)^T \cdot X'Y\) Every cooking tradition throughout the world as captured by Anthony Bourdin
\(\%\), Delivery#
\(\beta\) The various parameters of a meal & back propagation may determine the relative weights
Show code cell source
import matplotlib.pyplot as plt
import numpy as np

# Clock settings; f(t) random disturbances making "paradise lost"
clock_face_radius = 1.0
number_of_ticks = 8
tick_labels = [
    "Hierarchical", "Timing", "Qualities", "Delivery",
    "Gastronomical", "Smell", "Appearance", "Taste"
]

# Calculate the angles for each tick (in radians)
angles = np.linspace(0, 2 * np.pi, number_of_ticks, endpoint=False)
# Inverting the order to make it counterclockwise
angles = angles[::-1]

# Create figure and axis
fig, ax = plt.subplots(figsize=(8, 8))
ax.set_xlim(-1.2, 1.2)
ax.set_ylim(-1.2, 1.2)
ax.set_aspect('equal')

# Draw the clock face
clock_face = plt.Circle((0, 0), clock_face_radius, color='lightgrey', fill=True)
ax.add_patch(clock_face)

# Draw the ticks and labels
for angle, label in zip(angles, tick_labels):
    x = clock_face_radius * np.cos(angle)
    y = clock_face_radius * np.sin(angle)

    # Draw the tick
    ax.plot([0, x], [0, y], color='black')

    # Positioning the labels slightly outside the clock face
    label_x = 1.1 * clock_face_radius * np.cos(angle)
    label_y = 1.1 * clock_face_radius * np.sin(angle)

    # Adjusting label alignment based on its position
    ha = 'center'
    va = 'center'
    if np.cos(angle) > 0:
        ha = 'left'
    elif np.cos(angle) < 0:
        ha = 'right'
    if np.sin(angle) > 0:
        va = 'bottom'
    elif np.sin(angle) < 0:
        va = 'top'

    ax.text(label_x, label_y, label, horizontalalignment=ha, verticalalignment=va, fontsize=10)

# Remove axes
ax.axis('off')

# Show the plot
plt.show()
Show code cell output
\(SV'\) What it takes to “hit the spot” & this may vary in same person depending on day, place, & mood