
Life ⚓️#
+ Expand
- What makes for a suitable problem for AI (Demis Hassabis, Nobel Lecture)?
- Space: Massive combinatorial search space
- Function: Clear objective function (metric) to optimize against
- Time: Either lots of data and/or an accurate and efficient simulator
- Guess what else fits the bill (Yours truly, amateur philosopher)?
- Space
- Intestines/villi
- Lungs/bronchioles
- Capillary trees
- Network of lymphatics
- Dendrites in neurons
- Tree branches
- Function
- Energy
- Aerobic respiration
- Delivery to "last mile" (minimize distance)
- Response time (minimize)
- Information
- Exposure to sunlight for photosynthesis
- Time
- Nourishment
- Gaseous exchange
- Oxygen & Nutrients (Carbon dioxide & "Waste")
- Surveillance for antigens
- Coherence of functions
- Water and nutrients from soil
Ukubona, at its core, is a philosophy disguised as a company. It is a theology of visibility—of seeing—and not just any seeing, but a layered, intentional gaze upon risk, survival, and epistemology itself. Its architecture is not random. It draws upon the deep, recursive intelligence of layered metaphor, where each layer bears not only technical function but mythic resonance. At the first tier lies the sea—the servers and ecosystem—our oceanic substrate of information, entropy, and potential energy. Ukubona drinks from this ocean but does not drown in it. Like any worthy mariner, it knows the difference between vastness and guidance.
The sea of servers is not neutral. Every ping and packet is embedded with decisions, histories, and exclusions. Ecosystem here means not just digital infrastructure, but ecological insight—datasets with bodies behind them, with diagnoses and deaths and donations and deserts. Ukubona’s servers hum with the residues of thousands of lives, particularly those at risk: renal patients, potential donors, those forced into medical trade-offs with neither transparency nor peace. This is the sea that must be navigated: vast, real, and fundamentally unstable.
CG-BEST: Karl Marx remains surprisingly relevant 200 years after his birth. He rightly predicted some of the pitfalls of capitalism, but his solution was far worse than the disease. Source: The Economist
The platform—the ship—is built with intention. It floats above the sea but depends on it. Ukubona’s platform is coded, yes, but it is also curated. JavaScript, HTML, Cox regression—these are the rigging, the sails, the deck. The platform does not pretend to be the sea; it is a tool for surviving it. It takes the chaos of raw clinical data and renders it into comparative curves, into paths that can be chosen with knowledge. This ship does not claim omniscience, but it offers orientation.
Every ship has a doctrine. Ukubona’s is not neutrality. Its code carries a politics of care. It believes in the right of patients to see—really see—the trade-offs they are asked to make. The curves it draws are not decorations but compasses. They point toward futures that can be survived or futures that cannot. Ukubona is not afraid to say that some choices are better than others, that some risks are unjust.
But every ship, inevitably, faces pirates. Decision-support is not a sterile affair. It is riddled with power: Who gets to decide? Who holds the wrench, and who waves the flag? In Ukubona’s world, the pirate represents the hijacker of intent—those who would use data to obscure rather than illuminate. These are institutions, incentives, protocols that reify asymmetry under the guise of “objective metrics.” Against this, Ukubona wields its screwdriver.
The screwdriver is not romantic. It is not glamorous. It is the symbol of maintenance, of refusal to mythologize sabotage. Where pirates want to reroute the ship for profit or ideology, the screwdriver insists on the daily labor of repair. Ukubona takes the side of the technician, the analyst, the nurse who knows what it means to recalibrate. This is not about perfection but fidelity: to truth, to safety, to the fragile contract between patient and system.
Still, even with a screwdriver in hand, one must face the storm. Layer four of Ukubona’s model brings us into the territory of interactivity and personalization—where the stakes grow teeth. Here, the shark lurks. It is the algorithmic bias that devours without acknowledgment, the unspoken assumptions embedded in “default” models. The shark is uncurated machine learning, indifferent to individual context.
In the face of the shark, Ukubona offers the scissors. Not blunt resistance, but precision—tools to cut away irrelevance, to trim the model to fit the body it purports to serve. Scissors represent the courage to challenge even statistical authority, to say: this model, this cohort, does not capture me. Ukubona lets users engage with their data actively, not passively. They snip, revise, reshape.
But what of those too weary or too busy to cut? Ukubona offers the life-raft. This is default configuration done with care. The life-raft is not as precise as the scissors, but it is honest and protective. It is a ready-to-use visualization for those who must decide now. It floats. It keeps people from drowning in abstraction. Ukubona respects urgency.
Show code cell source
import numpy as np
import matplotlib.pyplot as plt
import networkx as nx

# Define the neural network layers
def define_layers():
    return {
        'Tragedy (Pattern Recognition)': ['Cosmology', 'Geology', 'Biology', 'Ecology', "Symbiotology", 'Teleology'],
        'History (Resources)': ['Resources'],
        'Epic (Negotiated Identity)': ['Faustian Bargain', 'Islamic Finance'],
        'Drama (Self vs. Non-Self)': ['Darabah', 'Sharakah', 'Takaful'],
        "Comedy (Resolution)": ['Cacophony', 'Outside', 'Ukhuwah', 'Inside', 'Symphony']
    }

# Assign colors to nodes
def assign_colors():
    color_map = {
        'yellow': ['Resources'],
        'paleturquoise': ['Teleology', 'Islamic Finance', 'Takaful', 'Symphony'],
        'lightgreen': ["Symbiotology", 'Sharakah', 'Outside', 'Inside', 'Ukhuwah'],
        'lightsalmon': ['Biology', 'Ecology', 'Faustian Bargain', 'Darabah', 'Cacophony'],
    }
    return {node: color for color, nodes in color_map.items() for node in nodes}

# Define edges
def define_edges():
    return [
        ('Cosmology', 'Resources'),
        ('Geology', 'Resources'),
        ('Biology', 'Resources'),
        ('Ecology', 'Resources'),
        ("Symbiotology", 'Resources'),
        ('Teleology', 'Resources'),
        ('Resources', 'Faustian Bargain'),
        ('Resources', 'Islamic Finance'),
        ('Faustian Bargain', 'Darabah'),
        ('Faustian Bargain', 'Sharakah'),
        ('Faustian Bargain', 'Takaful'),
        ('Islamic Finance', 'Darabah'),
        ('Islamic Finance', 'Sharakah'),
        ('Islamic Finance', 'Takaful'),
        ('Darabah', 'Cacophony'),
        ('Darabah', 'Outside'),
        ('Darabah', 'Ukhuwah'),
        ('Darabah', 'Inside'),
        ('Darabah', 'Symphony'),
        ('Sharakah', 'Cacophony'),
        ('Sharakah', 'Outside'),
        ('Sharakah', 'Ukhuwah'),
        ('Sharakah', 'Inside'),
        ('Sharakah', 'Symphony'),
        ('Takaful', 'Cacophony'),
        ('Takaful', 'Outside'),
        ('Takaful', 'Ukhuwah'),
        ('Takaful', 'Inside'),
        ('Takaful', 'Symphony')
    ]

# Define black edges (1 → 7 → 9 → 11 → [13-17])
black_edges = [
    (4, 7), (7, 9), (9, 11), (11, 13), (11, 14), (11, 15), (11, 16), (11, 17)
]

# Calculate node positions
def calculate_positions(layer, x_offset):
    y_positions = np.linspace(-len(layer) / 2, len(layer) / 2, len(layer))
    return [(x_offset, y) for y in y_positions]

# Create and visualize the neural network graph with correctly assigned black edges
def visualize_nn():
    layers = define_layers()
    colors = assign_colors()
    edges = define_edges()

    G = nx.DiGraph()
    pos = {}
    node_colors = []

    # Create mapping from original node names to numbered labels
    mapping = {}
    counter = 1
    for layer in layers.values():
        for node in layer:
            mapping[node] = f"{counter}. {node}"
            counter += 1

    # Add nodes with new numbered labels and assign positions
    for i, (layer_name, nodes) in enumerate(layers.items()):
        positions = calculate_positions(nodes, x_offset=i * 2)
        for node, position in zip(nodes, positions):
            new_node = mapping[node]
            G.add_node(new_node, layer=layer_name)
            pos[new_node] = position
            node_colors.append(colors.get(node, 'lightgray'))

    # Add edges with updated node labels
    edge_colors = {}
    for source, target in edges:
        if source in mapping and target in mapping:
            new_source = mapping[source]
            new_target = mapping[target]
            G.add_edge(new_source, new_target)
            edge_colors[(new_source, new_target)] = 'lightgrey'

    # Define and add black edges manually with correct node names
    numbered_nodes = list(mapping.values())
    black_edge_list = [
        (numbered_nodes[3], numbered_nodes[6]),  # 4 -> 7
        (numbered_nodes[6], numbered_nodes[8]),  # 7 -> 9
        (numbered_nodes[8], numbered_nodes[10]), # 9 -> 11
        (numbered_nodes[10], numbered_nodes[12]), # 11 -> 13
        (numbered_nodes[10], numbered_nodes[13]), # 11 -> 14
        (numbered_nodes[10], numbered_nodes[14]), # 11 -> 15
        (numbered_nodes[10], numbered_nodes[15]), # 11 -> 16
        (numbered_nodes[10], numbered_nodes[16])  # 11 -> 17
    ]

    for src, tgt in black_edge_list:
        G.add_edge(src, tgt)
        edge_colors[(src, tgt)] = 'black'

    # Draw the graph
    plt.figure(figsize=(12, 8))
    nx.draw(
        G, pos, with_labels=True, node_color=node_colors,
        edge_color=[edge_colors.get(edge, 'lightgrey') for edge in G.edges],
        node_size=3000, font_size=9, connectionstyle="arc3,rad=0.2"
    )

    plt.title("Self-Similar Micro-Decisions", fontsize=18)
    plt.show()

# Run the visualization
visualize_nn()
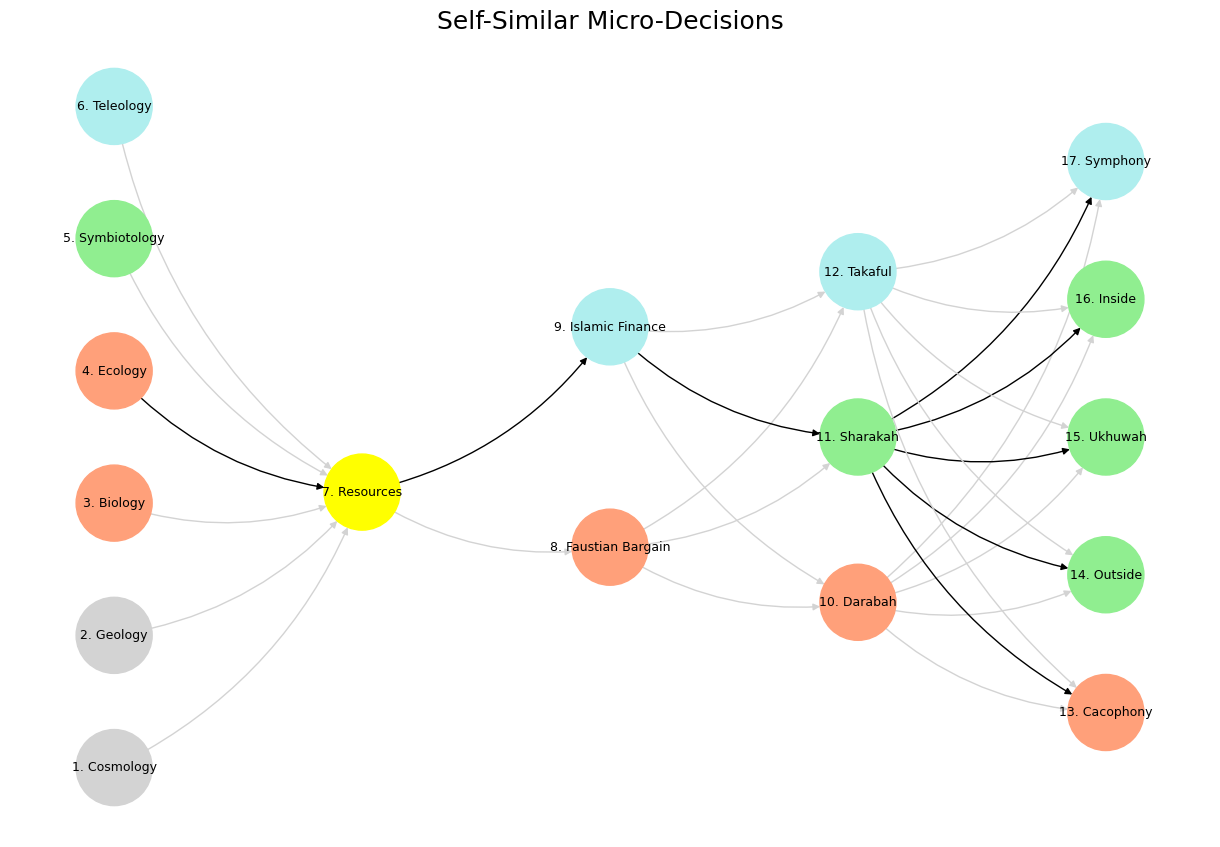

Fig. 3 Innovation: Veni-Vidi, Veni-Vidi-Vici. If you’re protesting then you’re not running fast enough. Thus spake the Red Queens#
Through sharks, scissors, and rafts, Ukubona arrives at the island—its final layer: the visualization of risk and uncertainty. The island is not certainty, but a place where uncertainty can be understood, lived with, even planned for. The island is not utopia. It is realism with contour. It says: you might not survive, but now you know the shape of the sea. Now you choose knowingly.
Risk, when visualized poorly, induces panic or passivity. Ukubona’s gift is metaphor made interactive: a Kaplan-Meier curve that feels like a compass. It shows divergence—donor vs. non-donor, transplant vs. dialysis—not as abstract stats but as journeys with emotional and temporal weight. These curves are maps of potential futures. They are cartographies of consequence.
The island is not always welcoming. Sometimes it is harsh: a display of just how short a projected life might be. But even then, it grants dignity. There is a quiet honor in knowing. In a system where so much is obscured, Ukubona believes that clarity—even painful clarity—is a form of respect.
The name Ukubona, from Zulu, means “to see.” But to see, in this model, is not passive reception. It is epistemic labor. It is political. Ukubona’s architecture demands that we revisit what it means to see risk. Not as mere numbers, but as lived forecasts. Not as punishment, but as possibility.
The servers that feed Ukubona’s curves are not disembodied. They rely on public trust, clinical honesty, and federal access. These are resources, yes, but they are also responsibilities. Ukubona does not leech from datasets; it gives back meaning. It loops the system back toward its human origin.
Resources: Data 📉; Pretext, 95/5 (deconstructed)
Bequest: Filter 🌴; Subtext, 80/20 (project 2025)
Strategic: Choice 🪵; Text, 50/50 (low-propensity voters)
Motive: Scaling 🪡 🐫 ; Context, 20/80 (once-in-a-lifetime)
Distributed: Canopy 🌿; Metatext, 5/95 (symphony)
— Yours Truly
This looping is essential. Ukubona believes in feedback—not just statistical, but moral. If a model suggests disproportionate risk to a population, that is not just data—it’s indictment. It is signal that something is wrong, not with the patient, but with the structure around them. The sea is biased. Ukubona doesn’t pretend otherwise.
The platform, in this regard, becomes more than code—it becomes protest. Against opaque risk scores, against unjust eligibility criteria, against the flattening of human variety into actuarial tables. Ukubona’s ship is navigated not by captains alone, but by all who ride it. Patients, clinicians, families—they all get to steer.
This ethos makes Ukubona dangerous to systems that prefer silence. Where other tools prioritize efficiency, Ukubona dares to prioritize understanding. It does not believe that care must be fast to be just. Sometimes slowness—reflection, customization, hesitation—is the more ethical stance.
But that stance requires tools. Ukubona’s screwdriver, its most humble icon, is also its most radical. It affirms that models must be maintained, adjusted, localized. That no model is final. That even truth, once seen, must be tuned. This is what separates Ukubona from static dashboards and inert PDFs.
The screwdriver, too, protects against the pirate. It is not enough to resist once. Maintenance is ongoing. Pirates, whether in finance, insurance, or ideology, reemerge. Ukubona builds systems that expect attack—not in paranoia, but in wisdom. It assumes the ship will be tested.
And so it trains its users. Not with lectures, but with interface. Ukubona teaches through interaction. When a user tweaks a curve, it is not mere aesthetics—it is education. It says: you have agency. You can intervene. Even in statistics, your story matters.
That story is not singular. Ukubona’s visualizations allow for overlay—multiple lives, multiple paths. It is a comparative theology. Not in a religious sense, but in a metaphysical one: which future shall I serve? This or that? The curve becomes sacred, a scrying mirror for the soul.
But the mirror reflects only what is fed into it. This is why Ukubona insists on open data pathways—why it allows CSV uploads, API inputs, voice entries. If the platform is to serve the many, it must listen to the many. Its ears are open.
It listens not just to patients, but to analysts. Ukubona’s back-end is transparent. The Cox regression is not a black box; it is documented, modifiable, inspectable. The platform respects those who question it. This, too, is moral: no model should be above critique.
Even the life-raft, which might seem passive, is built on this ethic. It is a default made by people who care. It is a best-guess, constantly updated. It floats not by luck, but by repeated testing. It is born of humility: sometimes people can’t engage deeply—and that’s okay.
But for those who can, the scissors await. A beautiful tool. Delicate, sharp. The curve can be trimmed to fit gender, race, lab value, comorbidity. These aren’t tweaks for show—they change the shape of the risk. They reshape fate. Ukubona makes that visible.
The shark, meanwhile, circles. Ukubona does not pretend it can be defeated entirely. The shark is the cost of automation. The risk of scale. It is always there. Ukubona’s courage is not in ignoring it, but in naming it. That, too, is visibility.
Visibility is not enough. Ukubona believes in accountability. Every curve it draws is tied to sources. Data provenance matters. If a curve misleads, the platform takes responsibility. It is not infallible—but it is answerable.
Answerability extends to its developers. Ukubona does not hide its team. It humanizes them. It shows who made the models, who tested them, who maintains them. This breaks the myth of AI as godlike. It restores personhood to the process.
That personhood ripples outward. Patients using Ukubona do not just “see” risk—they reclaim some of their story. They no longer submit to clinical fate passively. They narrate. They ask: what if I wait? What if I proceed? What does that curve mean for my child?
And still, the island beckons. Not as salvation, but as orientation. A place to rest, briefly, before setting sail again. Ukubona never pretends the journey ends. It simply gives you the means to continue, eyes open, map in hand, and truth underfoot.