Show code cell source
import matplotlib.pyplot as plt
import numpy as np
# Create data for the skill and challenge levels
skill_levels = np.linspace(0, 10, 100)
challenge_levels = np.linspace(0, 10, 100)
# Define the flow channel boundaries
flow_channel = skill_levels
# Adjust the phase and amplitude of the sinusoid wave
phase = np.pi / 16
amplitude = 1.5
sinusoid = flow_channel + np.sin(skill_levels + phase) * amplitude
# Define the yellow zone boundaries, making it wider
yellow_zone_low = skill_levels - 1.5 # Adjust this value to make the yellow zone wider or narrower
yellow_zone_high = skill_levels + 1.5 # Adjust this value to make the yellow zone wider or narrower
# Plotting
plt.figure(figsize=(15, 10))
# Plot the anxiety and boredom areas
plt.fill_between(skill_levels, yellow_zone_high, 10, color='orangered', alpha=0.3, label='Place/Identification', interpolate=True)
plt.fill_between(skill_levels, 0, yellow_zone_low, color='lime', alpha=0.3, label='Time/Revelation', interpolate=True)
plt.fill_between(skill_levels, yellow_zone_low, yellow_zone_high, color='yellow', alpha=0.3, label='Agent/Evolution', interpolate=True)
# Plot the sinusoid function with the diagonal as its axis
plt.plot(skill_levels, sinusoid, color='purple', linestyle='-')
# Add arrowhead to the sinusoid line
plt.arrow(skill_levels[-2], sinusoid[-2], skill_levels[-1] - skill_levels[-2], sinusoid[-1] - sinusoid[-2],
color='purple', length_includes_head=True, head_width=0.15, head_length=0.3)
# Set plot labels and title
plt.xlabel('Age', fontsize=18)
plt.ylabel('Résumé', rotation='vertical', fontsize=18)
# Set plot limits and grid
plt.xlim(0, 10)
plt.ylim(0, 10)
plt.grid(True)
# Set tick labels
tick_labels = ['0', '20', '40', '60', '80', '99']
plt.xticks(np.linspace(0, 10, 6), tick_labels)
plt.yticks(np.linspace(0, 10, 6), tick_labels)
# Add text annotations to label the areas without shaded background
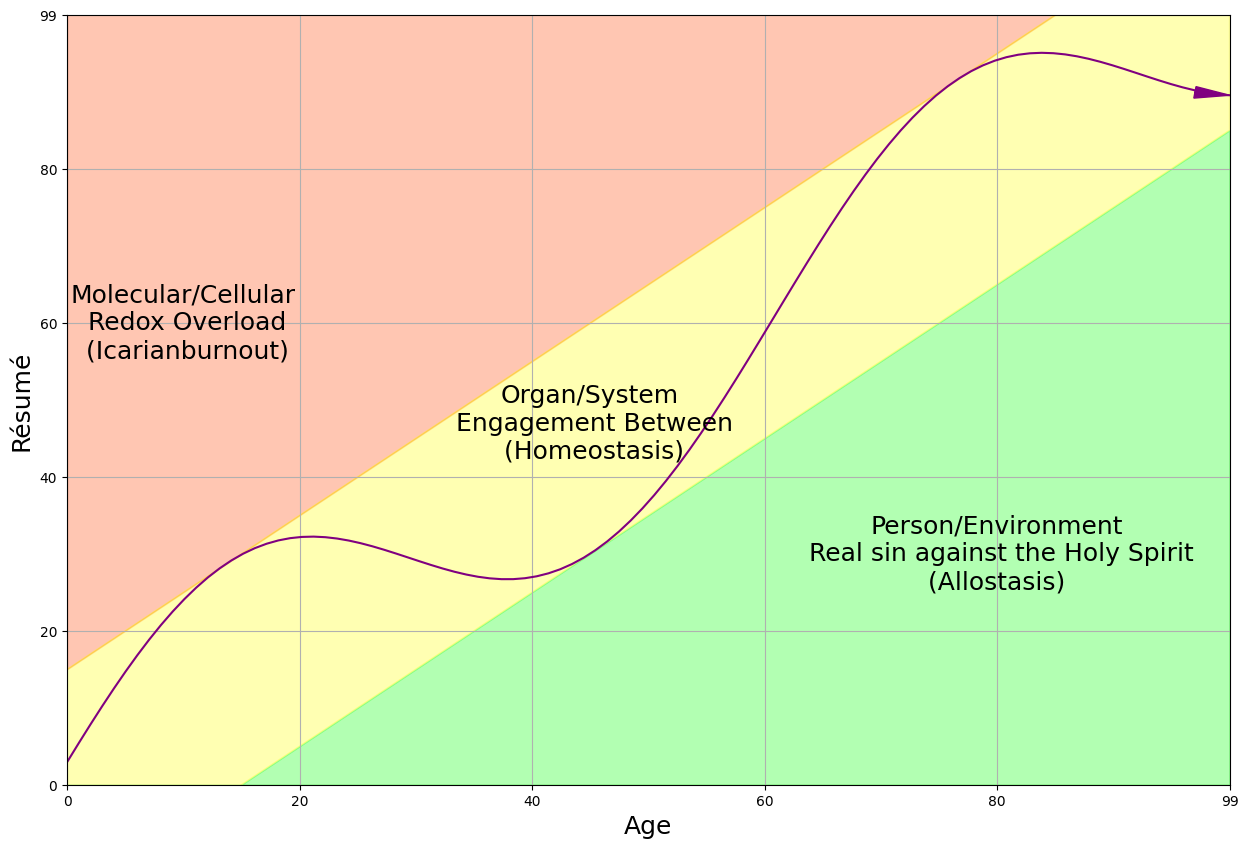
plt.text(1, 6, 'Molecular/Cellular\n Redox Overload\n (Icarianburnout)', color='black', ha='center', va='center', fontsize=18)
plt.text(4.5, 4.7, 'Organ/System\n Engagement Between\n (Homeostasis)', color='black', ha='center', va='center', fontsize=18)
plt.text(8, 3, 'Person/Environment\n Real sin against the Holy Spirit\n (Allostasis) ', color='black', ha='center', va='center', fontsize=18)
# Display the plot
plt.show()
Show code cell output
#
1. Hierarchy#

Let’s incorporate the hierarchy of “low energy,” starting from the cellular level and moving upward through tissue, systemic physiology, and ultimately behavior. Each level interacts dynamically with the others and finds its representation within the Green/Stagnant, Yellow/Growth, and Red/Overreaching zones. Molecular/Cellular/Redox, Organ/System/Homeostasis, Person/Environment/Allostasis
– within/between motifs for each; wherein low
iccspeaks to info, feedback, & complexity (cf. social systems that are most fraudulent; disease is mostly highicc: less info, feedback & complexity).
PGC-1α/mtDNA; Cellular-Tissue-Redox
Green Zone: At a mitochondrial level, insufficient demand could mean less efficient ATP production over time, as the body doesn’t see a need to optimize these cellular factories.
Yellow Zone: Optimal demand drives mitochondrial biogenesis, making each cell more effective at energy production and utility.
Red Zone: Chronic overexertion can result in mitochondrial dysfunction, impairing ATP production and contributing to oxidative stress.
Muscle/Bone; Organs-System-Homeostasis
Green Zone: Lack of stress on tissues can lead to muscle atrophy, bone density loss, and endocrine imbalance.
Yellow Zone: Optimal stress through activities like weight-bearing exercises enhances muscle mass, increases bone density, and optimizes hormonal balance.
Red Zone: Overexertion can result in tissue injuries, hormonal imbalances, and chronic inflammation.
Independence/Frailty; Person-Environment-Allostasis
Green Zone: Reduced activity may lead to slow walking speeds, muscle wastage (sarcopenia), and low grip strength as measured by a dynamometer and the Fried/Johns Hopkins frailty phenotype.
Yellow Zone: Here you’ll find a balance between exertion and recovery. Walking speed is optimal, muscle mass is maintained, and grip strength is robust.
Red Zone: Chronic stress might manifest as reduced walking speed due to fatigue, muscle strain, and lowered dynamometer scores due to overuse injuries.
Philosophical Overlay: Nietzsche’s Quote “What does not kill me makes me stronger”:
This idea aligns well with the Yellow Zone, capturing the essence of “eustress,” or beneficial stress. It’s about seeking challenges that are manageable but not overwhelming, fostering growth at each level of this hierarchy—from mitochondrial efficiency to optimal behavioral outputs like walking speed.
In summary, each level of this energy hierarchy is profoundly affected by your life’s “zone.” Strive for that Yellow Zone across all dimensions to achieve a state of optimal stress that enhances your physiological and psychological well-being.
2. Allostasis#
\( \Large \left\{ \begin{array}{ll} \text{Truth} \\ \text{} \\ \text{Knowledge} \ \ \left\{ \begin{array}{l} \text{Rigor} \text{} \\ \text{Error} \ \ \ \ \ \ \ \ \ \left\{ \begin{array}{l} \text{Variance} \\ \text{Bias} \end{array} \right. \\ \text{Sloppy} \end{array} \right. \left\{ \begin{array}{l} \text{Explain/Control} \end{array} \right. \\ \text{} \\ \text{Morality} \end{array} \right. \)
Red Zone (Overreaching)
General Perspective
This zone represents chronic stress and exhaustion, which can result in deleterious health outcomes like burnout.
Stress Response
Allostatic Load: In this zone, stress becomes maladaptive, contributing to a high allostatic load that overtaxes physiological systems.
Sleep & Circadian Rhythms: Chronic stress and overreaching often lead to sleep deprivation and circadian disruptions, compounding health risks.
Why It’s Not Sustainable
Studies have shown that poor sleep and chronic stress are linked to metabolic dysregulation, elevated cortisol levels, cognitive impairments, and an increased risk of dementia.
Yellow Zone (Growth)
General Perspective
In the Yellow Zone, you’re in a state of optimal stress, often referred to as eustress. This is the type of stress that promotes growth and learning.
Stress Response
Allostatic Load: Here, stress acts as an adaptive factor, enhancing resilience by requiring your systems to continually adapt and find new equilibriums.
Sleep & Circadian Rhythms: Being engaged and active generally encourages a healthy sleep cycle, assuming you also prioritize sleep and its quality.
Why It’s Ideal
The physiological changes in this zone are adaptive. Sleep is usually good, and stressors tend to improve rather than deplete long-term health. The stress response is active but not overactive, allowing for repair and recovery.
Green Zone (Stagnant)
General Perspective
In the Green Zone, you might think you’re avoiding stress (ie variance in environment), but this is deceptive. The absence of challenge and growth can actually increase frailty over time (ie bias in homeostasis), especially for older individuals.
Stress Response
Allostatic Load: Even though stress may seem low, the absence of growth and challenge can cause gradual wear and tear on the body due to a lack of adaptive stressors.
Sleep & Circadian Rhythms: Lack of engagement can lead to poor sleep hygiene and potential circadian disruption, which may not be acute but can build over time.
Why It’s Not Ideal
Lack of stressors may create a pseudo-balance (
counterfeiting) in neuroendocrine function, but it’s a fragile one. As we age, this absence of stressors may accelerate physical decline and reduce cognitive resilience (existential fatigue,physical frailty).
3. Clustering#
Show code cell source
import matplotlib.pyplot as plt
import numpy as np

# Time steps
time_steps = np.arange(0, 100)

# Initialize variables for complexity
green_complexity = []
yellow_complexity = []
red_complexity = []

# Start initial complexity at 50
initial_complexity = 50

# Green Zone (Enfeebles): Complexity remains largely flat
green_complexity = np.full_like(time_steps, initial_complexity)

# Yellow Zone (Makes Stronger): Complexity increases linearly
yellow_complexity = initial_complexity + 0.5 * time_steps

# Red Zone (Kills): Complexity increases steeply, then drops
red_multiplier = 1.5
burnout_point = 40
red_complexity = initial_complexity + red_multiplier * time_steps
red_complexity[burnout_point:] = red_complexity[burnout_point] - 3 * (time_steps[burnout_point:] - burnout_point)

# Plotting
plt.figure(figsize=(10, 6))
line1, = plt.plot(time_steps, green_complexity, color='green')
line2, = plt.plot(time_steps, yellow_complexity, color='yellow')
line3, = plt.plot(time_steps, red_complexity, color='red')

# Labels and title
plt.xlabel('Time Steps')
plt.ylabel('Complexity Level')
plt.title('Changes in Complexity Over Time')

# Custom order of legend
plt.legend([line3, line2, line1], ['DoesKill', 'Stronger', 'Enfeebles'])

plt.grid(True)
plt.show()
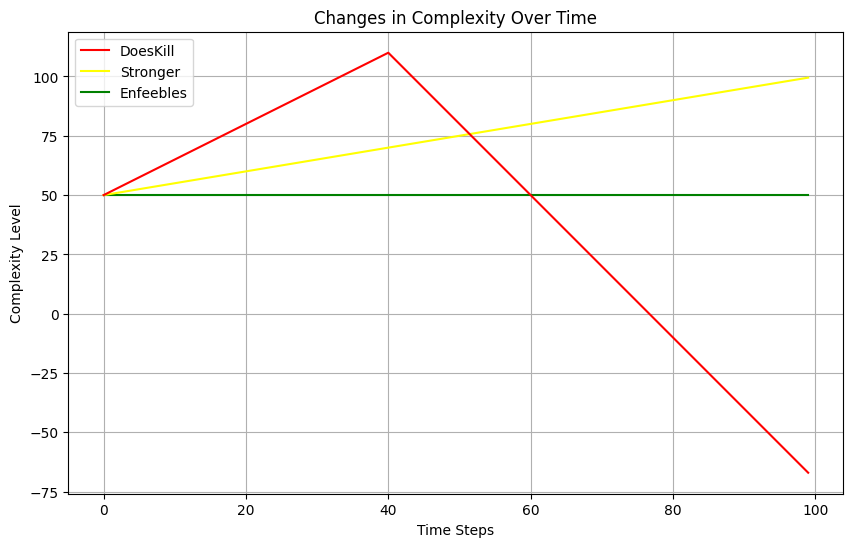
Frailty and ICC: A Correlative Analysis
Molecular/Cellular Level: At the most fundamental level, reduced molecular complexity (within tissue variance/environment->dna/histone, \(\sigma^2\)) in the elderly could manifest as fewer types of functional proteins or enzymes, lower responsiveness to environmental exigences, which could correlate with a higher ICC; Red Zone (“DoesKill”): Exceeding biological limits to the point where it becomes dangerous, leading to potential harm or death. (e.g., a diet that leads to obesity, insulin resistance, and \(\beta\)-cell apoptosis)
Organ/System Level: Reduced cellular cooperation (between tissue variance/paracrine->systems, \(\tau^2\)) and diminished repair mechanisms could be indicative of increased tissue-level ICCs (less cooperation, more variance between, cacophony); allignment with the Yellow Zone (“Makes Stronger”): The ideal state where individuals continually adapt and grow stronger through facing and overcoming challenges.
Person/Environment Level: Systems such as the cardiovascular, endocrine, or nervous systems might no longer lend sufficient support to the musculoskeletal system in response to exigences, showing reduced behavior range, agility, and independence score on ADL; aligns with the Green Zone (“Enfeebles”): A state of untapped potential that, if sustained, will weaken an individual over time, leading to frailty.
In terms of interventions and lifestyle recommendations, this clear delineation could help:
Those approaching the Red Zone might need interventions to dial back and understand their biological limits better, to prevent entering a dangerous territory (Icarus is flying too close to the Sun).
For those in the Yellow Zone, maintenance and slight increments in challenge levels could help them stay robust (Two roads diverged in a yellow wood).
People in the Green Zone might benefit from gradually escalating challenges to build complexity and resilience (He lays me by green pastures, still waters).
This classification is stark in its implications and could guide both policy and individual decisions in a highly actionable way.
Given this correlation, it’s likely that interventions designed to lower ICC (signal transduction, feedback systems, and more correlation between systems - symphony; together with responsive dna/histones in light of dynamic needs of changing environment) might also serve to reduce frailty. These could include both physical and cognitive exercises tailored to enhance system-wide engagement and sustain native complexity.
So, in terms of ICCs, frailty might be viewed as a state of reduced complexity and lower adaptability to environmental challenges. A frail individual might not only have fewer ‘tokens’ to play with, but their tokens might be less diverse, leading to less robust solutions to life’s challenges, both expected and unexpected.
4. Fatigue#
Existential fatigue is an interesting concept that lies at the intersection of philosophy and psychology, and can even have physiological manifestations. In the context you’re describing, it might be seen as an internal state of weariness or exhaustion that affects an individual’s ability to adapt to changing external environments.
Traditionally, “homeostasis” refers to the body’s ability to maintain a stable internal environment in response to changes in the external environment. When the internal homeostatic mechanisms are strong and resilient, a person is better equipped to cope with varying external conditions.
However, “allostasis” refers to the process of achieving stability through change, which involves actively adjusting to perceived or anticipated challenges. Allostatic mechanisms help us adapt and anticipate challenges, but they can also get overloaded, leading to “allostatic load” or “allostatic overload.”
If someone is experiencing existential fatigue, they might indeed seek a constant external environment to reduce the allostatic load. But doing so might not be a solution in the long term, especially if the internal environment itself isn’t stable. One could argue that leaning too heavily on a constant external environment as a crutch could actually weaken one’s adaptive capacity, thereby misrepresenting the concept of allostasis.
Instead of giving allostasis a bad name, perhaps we should consider existential fatigue as a signal that allostatic mechanisms need to be strengthened, not avoided. This could mean engaging in mental, emotional, and physical practices that boost resilience and adaptive capacity, both physiologically and psychologically.
5. Epistemology#
“The effect of the ugly can be measured using a dynamometer - Nietzsche”
Red Zone: Symphony Turns Solo
In the Red Zone, ICCs start low, indicating an initially well-coordinated symphony of systems that begins to crumble as one reaches the extremes of their abilities. The attempt to fly too close to the sun, so to speak, results in a system that becomes increasingly isolated, leading to an ‘ugly’ reality characterized by the risk of burnout and ultimate failure.
Yellow Zone: The Ideal Harmony
The Yellow Zone represents a sweet spot where low ICCs also indicate a harmonious symphony of different systems. It captures Nietzsche’s essence that “what doesn’t kill you makes you stronger.” Here, the finely-tuned interplay of challenge and resilience renders the ‘ugly’ into something complex and beautiful.
Green Zone: Cacophony in Frailty
Contrary to the Red and Yellow Zones, the Green Zone is where high ICCs reflect a lack of coordination, a cacophony signaling the breakdown of the system. This state of frailty, characterized by an inability to adapt or grow, is the embodiment of Nietzsche’s ‘ugly’ that can be quantified and understood by slow walking speeds, muscle wastage (sarcopenia), and low grip strength as measured by a dynamometer and the Fried/Johns Hopkins frailty phenotype.
Final Thoughts
In this revised understanding, ICCs serve as our modern-day dynamometers, acting as tools to measure the ‘ugly’ in each zone. Whether it’s the disintegration of harmony in the Red Zone, the ideal balance in the Yellow Zone, or the fraught disarray in the Green Zone, we are given a powerful metric to understand the complexities of human adaptability and frailty.