Father-to-son#
What you owe your children:
A succinct worldview
Food & shelter
Love
              1. f(t)
                    \
         2. S(t) -> 4. y:h'(f)=0;t(X'X).X'Y -> 5. b(c) -> 6. SV'
                    /
                    3. h(t)
\(\mu\), Chaos#
Text: distribution of social income
Cumulation of wealth
Time in life when most is made
\(\sigma\), Order#
Context: homogeneity vs. stronger influences of migration
\(\%\), Accuracy#
Pretext: vector of coefficients that determine subgroup identity
Individualized profile
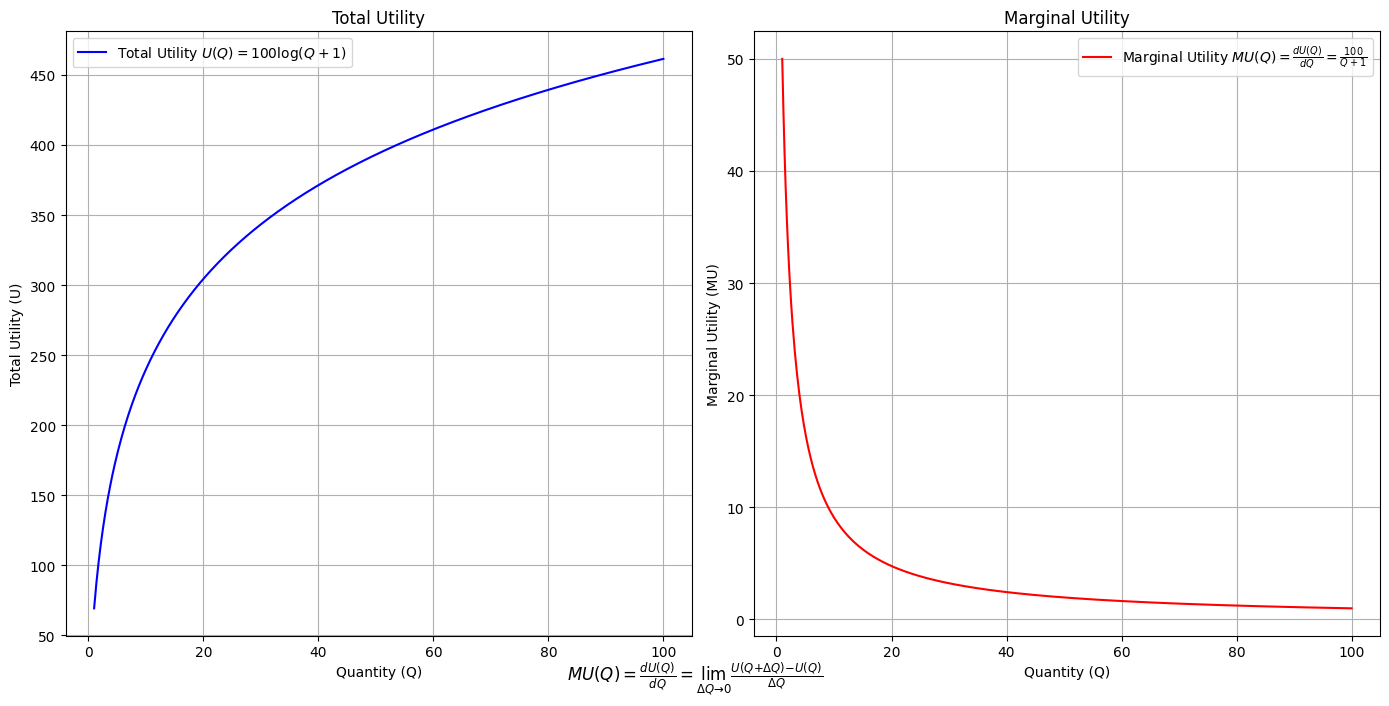
Show code cell source
import numpy as np
import matplotlib.pyplot as plt

# Define the total utility function U(Q)
def total_utility(Q):
    return 100 * np.log(Q + 1)  # Logarithmic utility function for illustration

# Define the marginal utility function MU(Q)
def marginal_utility(Q):
    return 100 / (Q + 1)  # Derivative of the total utility function

# Generate data
Q = np.linspace(1, 100, 500)  # Quantity range from 1 to 100
U = total_utility(Q)
MU = marginal_utility(Q)

# Plotting
plt.figure(figsize=(14, 7))

# Plot Total Utility
plt.subplot(1, 2, 1)
plt.plot(Q, U, label=r'Total Utility $U(Q) = 100 \log(Q + 1)$', color='blue')
plt.title('Total Utility')
plt.xlabel('Quantity (Q)')
plt.ylabel('Total Utility (U)')
plt.legend()
plt.grid(True)

# Plot Marginal Utility
plt.subplot(1, 2, 2)
plt.plot(Q, MU, label=r'Marginal Utility $MU(Q) = \frac{dU(Q)}{dQ} = \frac{100}{Q + 1}$', color='red')
plt.title('Marginal Utility')
plt.xlabel('Quantity (Q)')
plt.ylabel('Marginal Utility (MU)')
plt.legend()
plt.grid(True)

# Adding some calculus notation and Greek symbols
plt.figtext(0.5, 0.02, r"$MU(Q) = \frac{dU(Q)}{dQ} = \lim_{\Delta Q \to 0} \frac{U(Q + \Delta Q) - U(Q)}{\Delta Q}$", ha="center", fontsize=12)

plt.tight_layout()
plt.show()


Distribution of biological traits vs. family wealth. Capitalism is associated with the Weibull distribution. Communism claims to offer a uniform distribution.#
This framework captures concepts like archetype, verotype, stereotype, and mytype
Base-case (from largest subgroup)
\(f(t)\)
\(S(t)\)
\(h(t)\)
Group \((X'X)^T \cdot X'Y\)
Individual
Subgroup \(\beta\)
Personalized \(SV'\)

