Platform#
Show code cell source
import networkx as nx
import matplotlib.pyplot as plt
import numpy as np

# Define layers for the multi-layer symmetric neural network representing human biology
# The innermost layer is quantum mechanics, progressing outward to -omics, molecular biology, and more

# Define all layers of nodes
layers = {
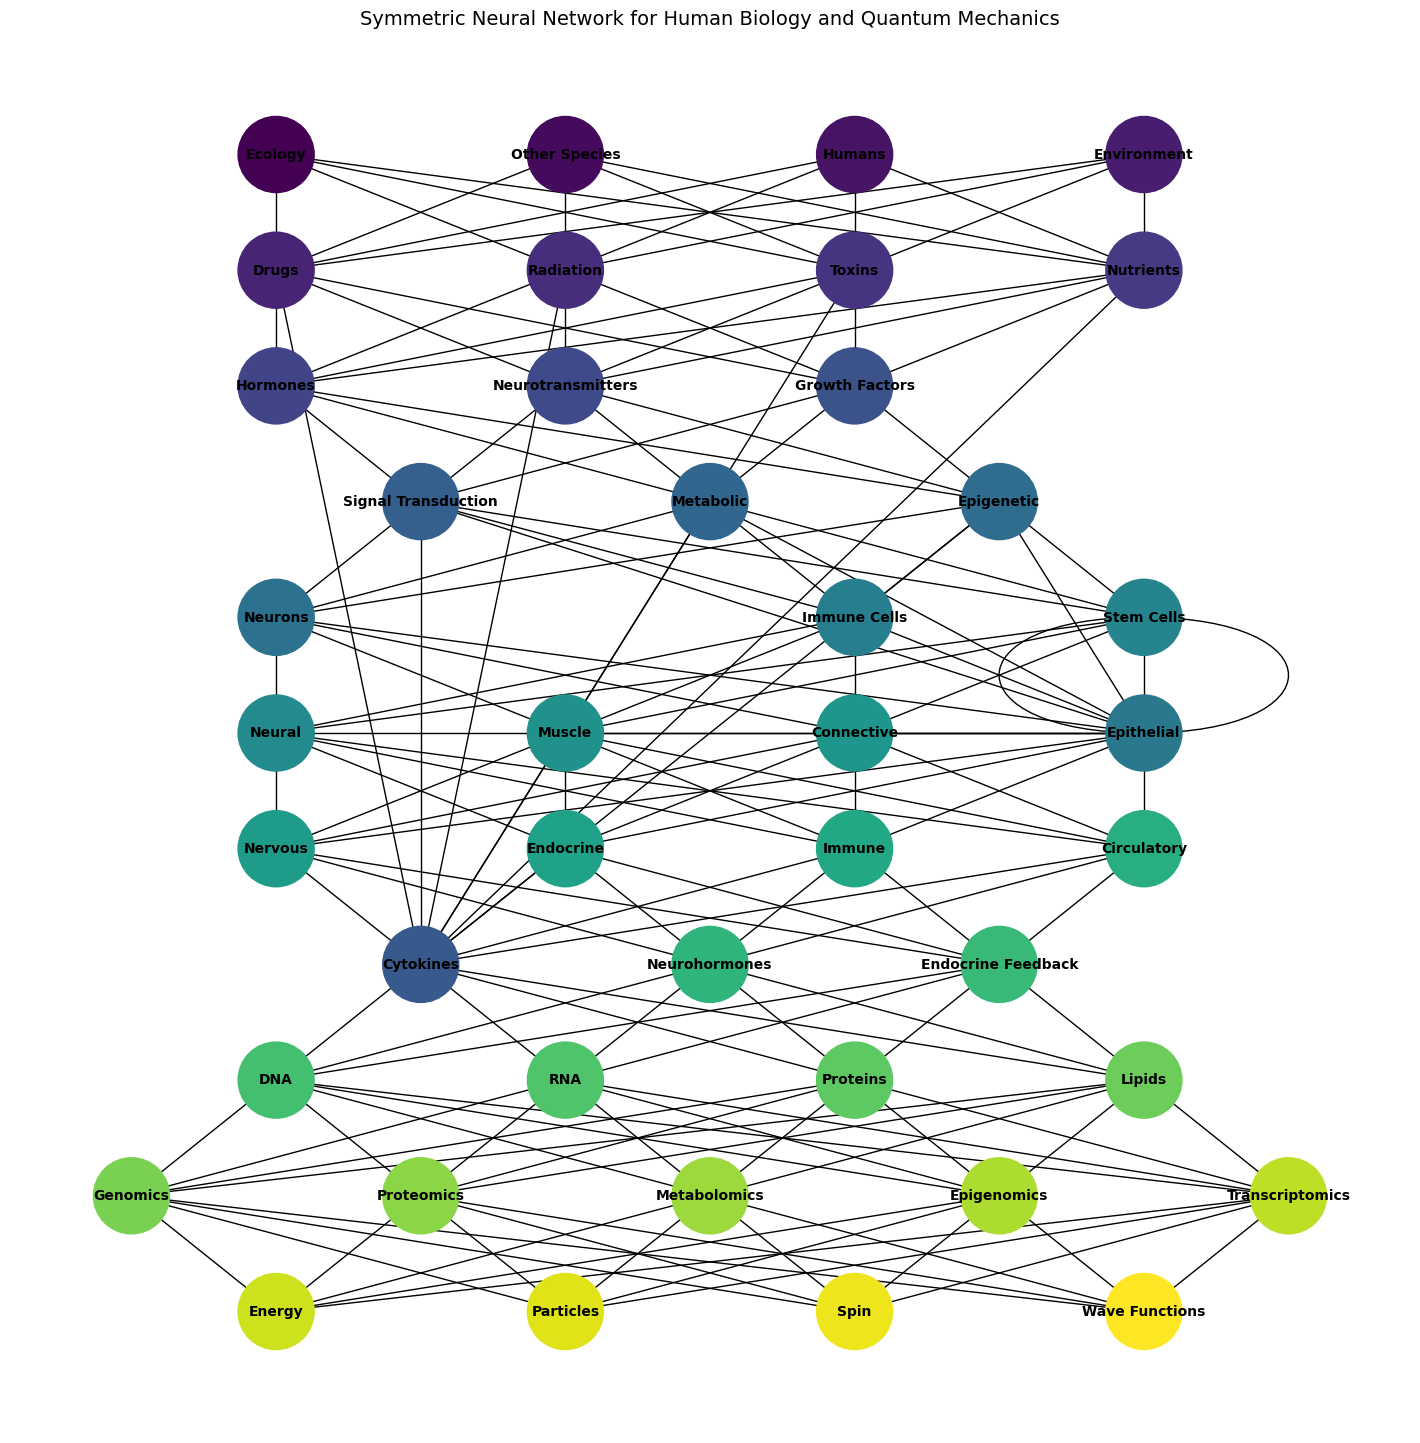
    "Biology": ['Ecology', 'Other Species', 'Humans', 'Environment'],
    "Drugs and External Factors": ['Drugs', 'Radiation', 'Toxins', 'Nutrients'],
    "Ligands & Receptors": ['Hormones', 'Neurotransmitters', 'Growth Factors', 'Cytokines'],
    "Pathways": ['Signal Transduction', 'Metabolic', 'Epigenetic'],
    "Cells": ['Neurons', 'Epithelial', 'Immune Cells', 'Stem Cells'],
    "Tissues": ['Neural', 'Muscle', 'Connective', 'Epithelial'],
    "Systems": ['Nervous', 'Endocrine', 'Immune', 'Circulatory'],
    "Immuno-Neuro-Endocrinology": ['Cytokines', 'Neurohormones', 'Endocrine Feedback'],
    "Molecular Biology": ['DNA', 'RNA', 'Proteins', 'Lipids'],
    "Omics": ['Genomics', 'Proteomics', 'Metabolomics', 'Epigenomics', 'Transcriptomics'],
    "Quantum": ['Energy', 'Particles', 'Spin', 'Wave Functions']
}

# Initialize the graph
G_biology = nx.DiGraph()

# Add nodes for each layer
for layer_name, nodes in layers.items():
    G_biology.add_nodes_from(nodes, layer=layer_name)

# Connect layers sequentially
layer_names = list(layers.keys())
for i in range(len(layer_names) - 1):
    source_layer = layers[layer_names[i]]
    target_layer = layers[layer_names[i + 1]]
    for source_node in source_layer:
        for target_node in target_layer:
            G_biology.add_edge(source_node, target_node)

# Define node positions for symmetric visualization
pos_biology = {}
layer_spacing = 2
node_spacing = 1.5

for i, (layer_name, nodes) in enumerate(layers.items()):
    y = -i * layer_spacing
    for j, node in enumerate(nodes):
        x = j * node_spacing - (len(nodes) - 1) * node_spacing / 2
        pos_biology[node] = (x, y)

# Correcting the mismatch between node colors and nodes in the graph
# Count the actual number of nodes in the graph
actual_node_count = len(G_biology.nodes())

# Generate colors based on the actual node count
node_colors_biology = plt.cm.viridis(np.linspace(0, 1, actual_node_count))

# Draw the graph with corrected color assignments
plt.figure(figsize=(14, 14))
nx.draw(
    G_biology,
    pos_biology,
    with_labels=True,
    node_size=3000,
    node_color=node_colors_biology,
    font_size=10,
    font_weight='bold',
    arrows=False
)

# Add title and remove axes for clean visualization
plt.title("Symmetric Neural Network for Human Biology and Quantum Mechanics", fontsize=14)
plt.axis('off')
plt.show()


Fig. 1 Move Over Freud, Jung, and Nietzsche. Here’s the visualization of the symmetric multilayer neural network representing human biology, progressing from outer biological, sociological, and psychological factors inward to quantum mechanics. Each layer is color-coded, and the network properly aligns node colors with the number of nodes. This is the first iteration built along with GPT-4o. Let the iterations begin!#

